TyroonTea 526945 full analysis,charts,indicators,moving averages,SMA,DMA,EMA,ADX,MACD,RSITyroon Tea 526945 WideScreen charts, DMA,SMA,EMA technical analysis, forecast prediction, by indicators ADX,MACD,RSI,CCI BSE stock exchange
Daily price and charts and targets TyroonTea Strong Daily Stock price targets for TyroonTea 526945 are 104.4 and 104.4 | Daily Target 1 | 104.4 | | Daily Target 2 | 104.4 | | Daily Target 3 | 104.4 | | Daily Target 4 | 104.4 | | Daily Target 5 | 104.4 |
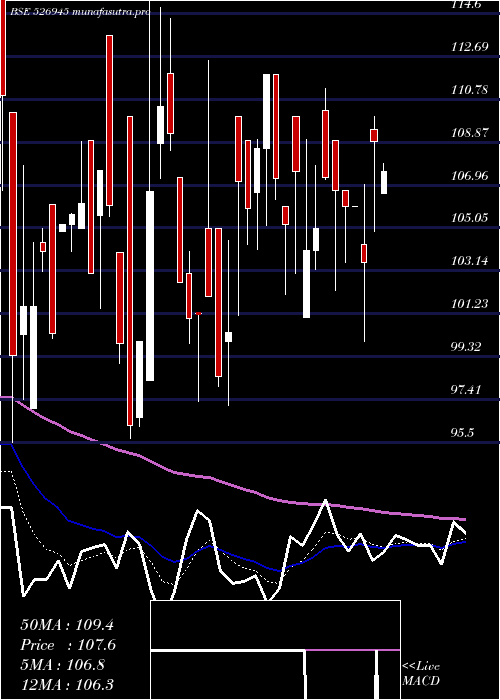
Daily price and volume Tyroon Tea
| Date |
Closing |
Open |
Range |
Volume |
Tue 21 October 2025 |
104.40 (2.91%) |
104.40 |
104.40 - 104.40 |
0.004 times |
Mon 20 October 2025 |
101.45 (2.11%) |
101.85 |
100.50 - 101.90 |
0.4903 times |
Fri 17 October 2025 |
99.35 (-2.41%) |
101.50 |
99.35 - 101.50 |
0.0633 times |
Thu 16 October 2025 |
101.80 (1.34%) |
100.45 |
100.45 - 101.85 |
0.0593 times |
Wed 15 October 2025 |
100.45 (-1.52%) |
100.10 |
99.05 - 101.35 |
2.3804 times |
Tue 14 October 2025 |
102.00 (0.1%) |
101.90 |
100.00 - 102.90 |
1.6093 times |
Mon 13 October 2025 |
101.90 (-0.88%) |
102.35 |
101.90 - 102.45 |
0.5773 times |
Fri 10 October 2025 |
102.80 (1.78%) |
100.35 |
100.35 - 102.80 |
1.1348 times |
Thu 09 October 2025 |
101.00 (-0.54%) |
100.70 |
100.70 - 103.60 |
1.036 times |
Wed 08 October 2025 |
101.55 (-4.92%) |
104.60 |
100.90 - 104.60 |
2.6453 times |
Tue 07 October 2025 |
106.80 (4.76%) |
102.40 |
100.65 - 106.80 |
0.344 times |
Weekly price and charts TyroonTea Strong weekly Stock price targets for TyroonTea 526945 are 102.45 and 106.35 | Weekly Target 1 | 99.2 | | Weekly Target 2 | 101.8 | | Weekly Target 3 | 103.1 | | Weekly Target 4 | 105.7 | | Weekly Target 5 | 107 |
Weekly price and volumes for Tyroon Tea
| Date |
Closing |
Open |
Range |
Volume |
Tue 21 October 2025 |
104.40 (5.08%) |
101.85 |
100.50 - 104.40 |
0.0421 times |
Fri 17 October 2025 |
99.35 (-3.36%) |
102.35 |
99.05 - 102.90 |
0.3992 times |
Fri 10 October 2025 |
102.80 (0.64%) |
102.15 |
100.00 - 106.80 |
0.5146 times |
Fri 03 October 2025 |
102.15 (1.64%) |
100.50 |
97.30 - 103.40 |
0.3271 times |
Fri 26 September 2025 |
100.50 (-0.1%) |
102.00 |
96.35 - 117.00 |
2.5056 times |
Fri 19 September 2025 |
100.60 (-0.4%) |
101.00 |
98.65 - 112.50 |
2.4168 times |
Fri 12 September 2025 |
101.00 (0.25%) |
100.25 |
100.25 - 104.00 |
0.3116 times |
Fri 05 September 2025 |
100.75 (-6.63%) |
107.00 |
98.35 - 108.00 |
0.9168 times |
Fri 29 August 2025 |
107.90 (-0.14%) |
114.40 |
103.10 - 114.40 |
0.419 times |
Fri 22 August 2025 |
108.05 (0.42%) |
108.00 |
100.45 - 114.75 |
2.1472 times |
Thu 14 August 2025 |
107.60 (-5.53%) |
113.90 |
107.10 - 116.70 |
0.2036 times |

Monthly price and charts TyroonTea Strong monthly Stock price targets for TyroonTea 526945 are 100.85 and 110.35 | Monthly Target 1 | 93.33 | | Monthly Target 2 | 98.87 | | Monthly Target 3 | 102.83333333333 | | Monthly Target 4 | 108.37 | | Monthly Target 5 | 112.33 |
Monthly price and volumes Tyroon Tea
| Date |
Closing |
Open |
Range |
Volume |
Tue 21 October 2025 |
104.40 (2%) |
101.70 |
97.30 - 106.80 |
0.1088 times |
Tue 30 September 2025 |
102.35 (-5.14%) |
107.00 |
96.35 - 117.00 |
0.5835 times |
Fri 29 August 2025 |
107.90 (-5.39%) |
114.05 |
100.45 - 117.90 |
0.3589 times |
Thu 31 July 2025 |
114.05 (8.62%) |
103.30 |
103.25 - 137.85 |
1.5455 times |
Mon 30 June 2025 |
105.00 (-2.62%) |
102.15 |
96.90 - 113.95 |
0.5693 times |
Fri 30 May 2025 |
107.82 (7.82%) |
100.00 |
97.11 - 115.00 |
0.655 times |
Wed 30 April 2025 |
100.00 (-7.02%) |
101.05 |
99.80 - 114.85 |
0.4087 times |
Fri 28 March 2025 |
107.55 (7.66%) |
110.00 |
95.65 - 120.00 |
0.3813 times |
Fri 28 February 2025 |
99.90 (-17.81%) |
124.95 |
95.50 - 125.00 |
0.7566 times |
Fri 31 January 2025 |
121.55 (2.62%) |
118.45 |
114.15 - 167.00 |
4.6324 times |
Tue 31 December 2024 |
118.45 (-5.28%) |
126.95 |
114.15 - 139.80 |
2.2446 times |

DMA SMA EMA moving averages of Tyroon Tea 526945
DMA (daily moving average) of Tyroon Tea 526945
| DMA period | DMA value | | 5 day DMA | 101.49 | | 12 day DMA | 102.12 | | 20 day DMA | 101.98 | | 35 day DMA | 102.1 | | 50 day DMA | 104.14 | | 100 day DMA | 106.83 | | 150 day DMA | 106.4 | | 200 day DMA | 109.44 | EMA (exponential moving average) of Tyroon Tea 526945
| EMA period | EMA current | EMA prev | EMA prev2 | | 5 day EMA | 102.19 | 101.08 | 100.9 | | 12 day EMA | 101.99 | 101.55 | 101.57 | | 20 day EMA | 102.23 | 102 | 102.06 | | 35 day EMA | 103.46 | 103.4 | 103.52 | | 50 day EMA | 104.64 | 104.65 | 104.78 |
SMA (simple moving average) of Tyroon Tea 526945
| SMA period | SMA current | SMA prev | SMA prev2 | | 5 day SMA | 101.49 | 101.01 | 101.1 | | 12 day SMA | 102.12 | 101.93 | 102.01 | | 20 day SMA | 101.98 | 101.89 | 101.85 | | 35 day SMA | 102.1 | 102.07 | 102.26 | | 50 day SMA | 104.14 | 104.26 | 104.43 | | 100 day SMA | 106.83 | 106.86 | 106.93 | | 150 day SMA | 106.4 | 106.37 | 106.34 | | 200 day SMA | 109.44 | 109.56 | 109.7 |
|
|
