MB 526935 full analysis,charts,indicators,moving averages,SMA,DMA,EMA,ADX,MACD,RSIM B 526935 WideScreen charts, DMA,SMA,EMA technical analysis, forecast prediction, by indicators ADX,MACD,RSI,CCI BSE stock exchange
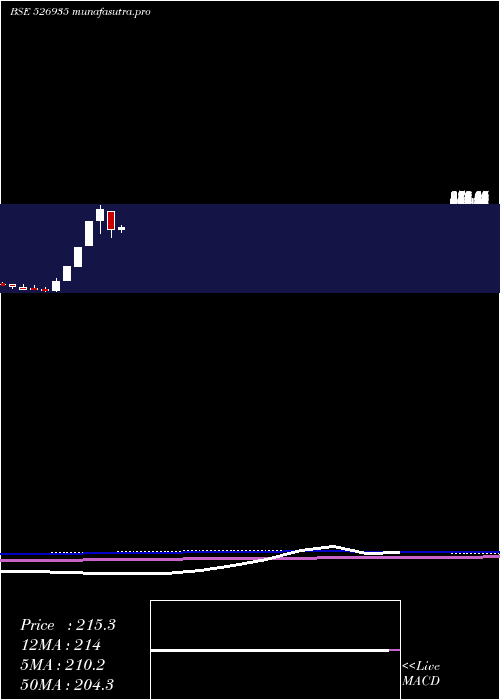
Daily price and charts and targets MB Strong Daily Stock price targets for MB 526935 are 155.93 and 155.98 | Daily Target 1 | 155.92 | | Daily Target 2 | 155.93 | | Daily Target 3 | 155.96666666667 | | Daily Target 4 | 155.98 | | Daily Target 5 | 156.02 |
Daily price and volume M B
| Date |
Closing |
Open |
Range |
Volume |
Fri 05 December 2025 |
155.95 (0.61%) |
156.00 |
155.95 - 156.00 |
1.4589 times |
Thu 04 December 2025 |
155.00 (1.97%) |
155.00 |
155.00 - 155.00 |
0.215 times |
Wed 03 December 2025 |
152.00 (1.98%) |
149.05 |
149.05 - 152.00 |
1.0322 times |
Tue 02 December 2025 |
149.05 (1.98%) |
149.05 |
147.90 - 149.05 |
2.5268 times |
Mon 01 December 2025 |
146.15 (1.98%) |
146.15 |
146.15 - 146.15 |
0.2668 times |
Fri 28 November 2025 |
143.31 (2%) |
143.31 |
143.31 - 143.31 |
2.637 times |
Thu 27 November 2025 |
140.50 (2%) |
140.50 |
140.50 - 140.50 |
0.4097 times |
Wed 26 November 2025 |
137.75 (2%) |
137.75 |
137.75 - 137.75 |
0.4534 times |
Tue 25 November 2025 |
135.05 (1.99%) |
135.05 |
135.05 - 135.05 |
0.6044 times |
Mon 24 November 2025 |
132.41 (2%) |
132.41 |
132.41 - 132.41 |
0.3959 times |
Fri 21 November 2025 |
129.82 (2%) |
129.82 |
129.82 - 129.82 |
0.1475 times |
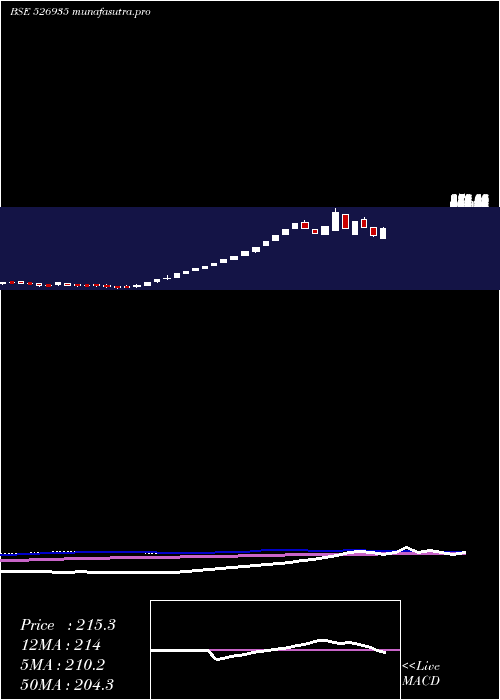
Weekly price and charts MB Strong weekly Stock price targets for MB 526935 are 151.05 and 160.9 | Weekly Target 1 | 142.85 | | Weekly Target 2 | 149.4 | | Weekly Target 3 | 152.7 | | Weekly Target 4 | 159.25 | | Weekly Target 5 | 162.55 |
Weekly price and volumes for M B
| Date |
Closing |
Open |
Range |
Volume |
Fri 05 December 2025 |
155.95 (8.82%) |
146.15 |
146.15 - 156.00 |
0.6308 times |
Fri 28 November 2025 |
143.31 (10.39%) |
132.41 |
132.41 - 143.31 |
0.5162 times |
Fri 21 November 2025 |
129.82 (10.38%) |
119.96 |
119.96 - 129.82 |
0.2629 times |
Fri 14 November 2025 |
117.61 (16.07%) |
103.90 |
98.00 - 117.61 |
1.5021 times |
Fri 07 November 2025 |
101.33 (16.94%) |
82.32 |
82.32 - 101.87 |
0.8332 times |
Fri 31 October 2025 |
86.65 (-1.71%) |
84.68 |
82.99 - 89.85 |
0.4371 times |
Thu 23 October 2025 |
88.16 (-2.04%) |
88.55 |
86.44 - 88.55 |
1.5471 times |
Fri 17 October 2025 |
90.00 (-2.06%) |
93.72 |
88.22 - 95.59 |
3.7155 times |
Fri 10 October 2025 |
91.89 (10.38%) |
84.91 |
84.91 - 91.89 |
0.4366 times |
Fri 03 October 2025 |
83.25 (8.22%) |
78.46 |
78.46 - 83.25 |
0.1184 times |
Fri 26 September 2025 |
76.93 (10.37%) |
71.09 |
71.09 - 76.93 |
0.7744 times |
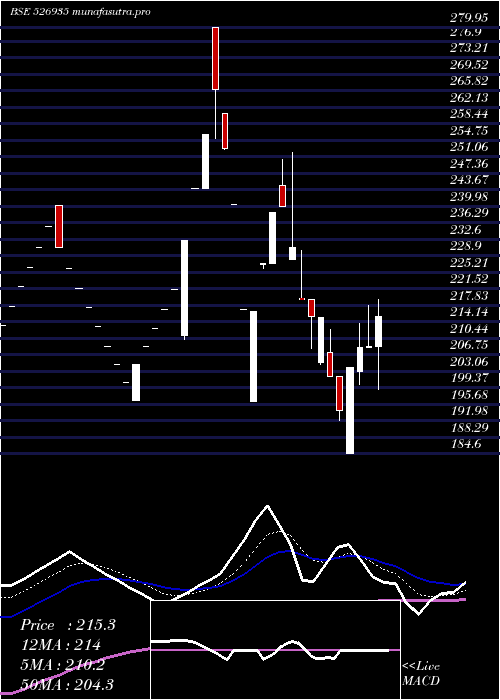
Monthly price and charts MB Strong monthly Stock price targets for MB 526935 are 151.05 and 160.9 | Monthly Target 1 | 142.85 | | Monthly Target 2 | 149.4 | | Monthly Target 3 | 152.7 | | Monthly Target 4 | 159.25 | | Monthly Target 5 | 162.55 |
Monthly price and volumes M B
| Date |
Closing |
Open |
Range |
Volume |
Fri 05 December 2025 |
155.95 (8.82%) |
146.15 |
146.15 - 156.00 |
0.5423 times |
Fri 28 November 2025 |
143.31 (65.39%) |
82.32 |
82.32 - 143.31 |
2.6771 times |
Fri 31 October 2025 |
86.65 (8.29%) |
81.62 |
81.62 - 95.59 |
5.2786 times |
Tue 30 September 2025 |
80.02 (54.33%) |
52.88 |
52.88 - 80.02 |
1.4448 times |
Fri 29 August 2025 |
51.85 (-90.08%) |
533.00 |
49.90 - 635.85 |
0.0143 times |
Thu 31 July 2025 |
522.55 (57.47%) |
338.45 |
338.00 - 522.55 |
0.0034 times |
Mon 30 June 2025 |
331.85 (51.22%) |
220.00 |
220.00 - 331.85 |
0.0188 times |
Fri 30 May 2025 |
219.45 (5.15%) |
208.70 |
199.00 - 252.65 |
0.0027 times |
Wed 30 April 2025 |
208.70 (-21.56%) |
260.75 |
184.60 - 260.75 |
0.0048 times |
Fri 28 March 2025 |
266.05 (15.25%) |
235.45 |
196.50 - 279.95 |
0.0133 times |
Fri 28 February 2025 |
230.85 (48.23%) |
162.00 |
162.00 - 230.85 |
0.0063 times |
DMA SMA EMA moving averages of M B 526935
DMA (daily moving average) of M B 526935
| DMA period | DMA value | | 5 day DMA | 151.63 | | 12 day DMA | 142.02 | | 20 day DMA | 130.49 | | 35 day DMA | 112.82 | | 50 day DMA | 103.55 | | 100 day DMA | 225.4 | | 150 day DMA | 238.66 | | 200 day DMA | 232.33 | EMA (exponential moving average) of M B 526935
| EMA period | EMA current | EMA prev | EMA prev2 | | 5 day EMA | 151.43 | 149.17 | 146.25 | | 12 day EMA | 141.93 | 139.38 | 136.54 | | 20 day EMA | 132.26 | 129.77 | 127.12 | | 35 day EMA | 118.95 | 116.77 | 114.52 | | 50 day EMA | 105.37 | 103.31 | 101.2 |
SMA (simple moving average) of M B 526935
| SMA period | SMA current | SMA prev | SMA prev2 | | 5 day SMA | 151.63 | 149.1 | 146.2 | | 12 day SMA | 142.02 | 139.22 | 136.3 | | 20 day SMA | 130.49 | 127.54 | 124.43 | | 35 day SMA | 112.82 | 111.05 | 109.24 | | 50 day SMA | 103.55 | 101.83 | 100.09 | | 100 day SMA | 225.4 | 227.65 | 229.84 | | 150 day SMA | 238.66 | 238.98 | 239.24 | | 200 day SMA | 232.33 | 232.36 | 232.36 |
|
|
