SpiceIsland 526827 full analysis,charts,indicators,moving averages,SMA,DMA,EMA,ADX,MACD,RSISpice Island 526827 WideScreen charts, DMA,SMA,EMA technical analysis, forecast prediction, by indicators ADX,MACD,RSI,CCI BSE stock exchange
Daily price and charts and targets SpiceIsland Strong Daily Stock price targets for SpiceIsland 526827 are 84.02 and 91.56 | Daily Target 1 | 82.16 | | Daily Target 2 | 85.87 | | Daily Target 3 | 89.703333333333 | | Daily Target 4 | 93.41 | | Daily Target 5 | 97.24 |
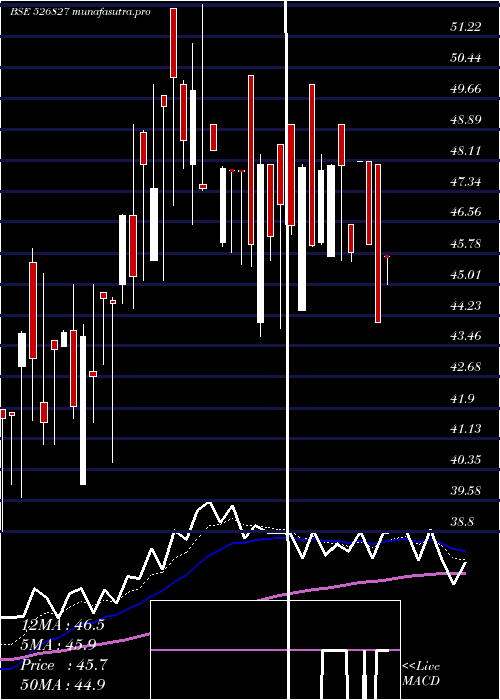
Daily price and volume Spice Island
| Date |
Closing |
Open |
Range |
Volume |
Tue 21 October 2025 |
89.57 (0.54%) |
93.54 |
86.00 - 93.54 |
0.7919 times |
Mon 20 October 2025 |
89.09 (2.32%) |
91.35 |
88.00 - 91.42 |
1.8533 times |
Fri 17 October 2025 |
87.07 (4.97%) |
83.70 |
82.00 - 87.09 |
4.282 times |
Thu 16 October 2025 |
82.95 (3.64%) |
83.99 |
81.00 - 83.99 |
0.9197 times |
Wed 15 October 2025 |
80.04 (4.86%) |
80.14 |
74.86 - 80.14 |
1.0683 times |
Tue 14 October 2025 |
76.33 (4.98%) |
76.30 |
71.00 - 76.34 |
0.6653 times |
Mon 13 October 2025 |
72.71 (-3.45%) |
75.31 |
71.55 - 79.07 |
0.3498 times |
Fri 10 October 2025 |
75.31 (-1.99%) |
75.31 |
75.31 - 75.31 |
0.002 times |
Thu 09 October 2025 |
76.84 (-1.99%) |
76.84 |
76.84 - 76.84 |
0.0632 times |
Wed 08 October 2025 |
78.40 (-2%) |
78.40 |
78.40 - 78.40 |
0.0045 times |
Mon 06 October 2025 |
80.00 (0.31%) |
81.30 |
78.16 - 81.30 |
0.1664 times |
Weekly price and charts SpiceIsland Strong weekly Stock price targets for SpiceIsland 526827 are 84.02 and 91.56 | Weekly Target 1 | 82.16 | | Weekly Target 2 | 85.87 | | Weekly Target 3 | 89.703333333333 | | Weekly Target 4 | 93.41 | | Weekly Target 5 | 97.24 |
Weekly price and volumes for Spice Island
| Date |
Closing |
Open |
Range |
Volume |
Tue 21 October 2025 |
89.57 (2.87%) |
91.35 |
86.00 - 93.54 |
0.2198 times |
Fri 17 October 2025 |
87.07 (15.62%) |
75.31 |
71.00 - 87.09 |
0.6055 times |
Fri 10 October 2025 |
75.31 (-5.57%) |
81.30 |
75.31 - 81.30 |
0.0196 times |
Fri 03 October 2025 |
79.75 (-1.73%) |
82.74 |
79.75 - 82.74 |
0.047 times |
Fri 26 September 2025 |
81.15 (6.18%) |
77.95 |
75.05 - 81.35 |
0.1736 times |
Fri 19 September 2025 |
76.43 (-5.26%) |
79.06 |
76.43 - 79.60 |
0.1327 times |
Fri 12 September 2025 |
80.67 (-3.64%) |
85.81 |
79.07 - 87.70 |
0.4224 times |
Fri 05 September 2025 |
83.72 (17.19%) |
71.09 |
71.09 - 86.38 |
2.7649 times |
Fri 29 August 2025 |
71.44 (-3.99%) |
70.69 |
70.55 - 80.69 |
3.1318 times |
Fri 22 August 2025 |
74.41 (-14.46%) |
90.95 |
74.41 - 95.00 |
2.4827 times |
Thu 14 August 2025 |
86.99 (26.29%) |
74.65 |
73.00 - 86.99 |
4.5226 times |

Monthly price and charts SpiceIsland Strong monthly Stock price targets for SpiceIsland 526827 are 80.29 and 102.83 | Monthly Target 1 | 62.16 | | Monthly Target 2 | 75.87 | | Monthly Target 3 | 84.703333333333 | | Monthly Target 4 | 98.41 | | Monthly Target 5 | 107.24 |
Monthly price and volumes Spice Island
| Date |
Closing |
Open |
Range |
Volume |
Tue 21 October 2025 |
89.57 (10%) |
81.39 |
71.00 - 93.54 |
0.3469 times |
Tue 30 September 2025 |
81.43 (13.98%) |
71.09 |
71.09 - 87.70 |
1.3664 times |
Fri 29 August 2025 |
71.44 (42.23%) |
52.50 |
49.61 - 95.00 |
5.104 times |
Thu 31 July 2025 |
50.23 (8.61%) |
47.95 |
42.56 - 51.05 |
0.8079 times |
Mon 30 June 2025 |
46.25 (0.98%) |
48.08 |
41.76 - 49.30 |
0.0886 times |
Fri 30 May 2025 |
45.80 (-8.12%) |
47.50 |
43.70 - 52.00 |
0.5705 times |
Mon 28 April 2025 |
49.85 (11.95%) |
45.00 |
44.40 - 51.91 |
0.2438 times |
Fri 28 March 2025 |
44.53 (30.97%) |
32.30 |
32.30 - 45.90 |
0.5545 times |
Fri 28 February 2025 |
34.00 (2.97%) |
34.70 |
31.60 - 40.42 |
0.2499 times |
Fri 31 January 2025 |
33.02 (-21.25%) |
41.09 |
33.02 - 41.09 |
0.6675 times |
Tue 31 December 2024 |
41.93 (-16.94%) |
48.15 |
41.93 - 51.50 |
0.0931 times |

DMA SMA EMA moving averages of Spice Island 526827
DMA (daily moving average) of Spice Island 526827
| DMA period | DMA value | | 5 day DMA | 85.74 | | 12 day DMA | 80.67 | | 20 day DMA | 80.31 | | 35 day DMA | 80.41 | | 50 day DMA | 79.66 | | 100 day DMA | 63.43 | | 150 day DMA | 56.45 | | 200 day DMA | 52.97 | EMA (exponential moving average) of Spice Island 526827
| EMA period | EMA current | EMA prev | EMA prev2 | | 5 day EMA | 86.04 | 84.27 | 81.86 | | 12 day EMA | 82.64 | 81.38 | 79.98 | | 20 day EMA | 81.21 | 80.33 | 79.41 | | 35 day EMA | 79.29 | 78.68 | 78.07 | | 50 day EMA | 78.16 | 77.69 | 77.22 |
SMA (simple moving average) of Spice Island 526827
| SMA period | SMA current | SMA prev | SMA prev2 | | 5 day SMA | 85.74 | 83.1 | 79.82 | | 12 day SMA | 80.67 | 79.99 | 79.35 | | 20 day SMA | 80.31 | 79.65 | 79.09 | | 35 day SMA | 80.41 | 79.89 | 79.47 | | 50 day SMA | 79.66 | 79.02 | 78.34 | | 100 day SMA | 63.43 | 63.01 | 62.58 | | 150 day SMA | 56.45 | 56.1 | 55.75 | | 200 day SMA | 52.97 | 52.75 | 52.54 |
|
|
