GreenplyInd 526797 full analysis,charts,indicators,moving averages,SMA,DMA,EMA,ADX,MACD,RSIGreenply Ind 526797 WideScreen charts, DMA,SMA,EMA technical analysis, forecast prediction, by indicators ADX,MACD,RSI,CCI BSE stock exchange
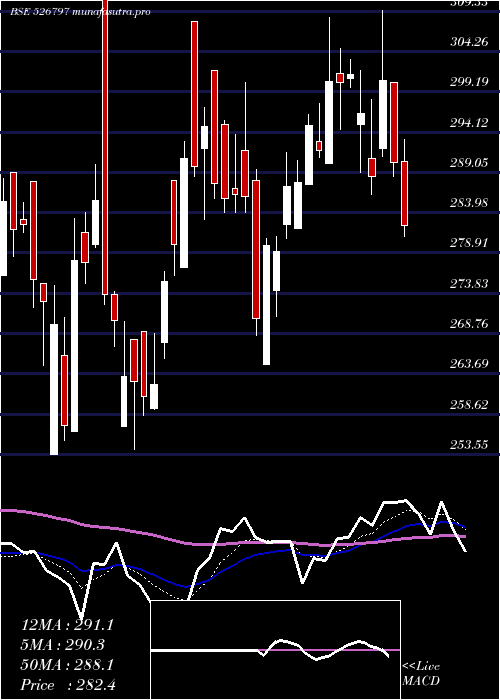
Daily price and charts and targets GreenplyInd Strong Daily Stock price targets for GreenplyInd 526797 are 305.78 and 316.78 | Daily Target 1 | 297.82 | | Daily Target 2 | 302.73 | | Daily Target 3 | 308.81666666667 | | Daily Target 4 | 313.73 | | Daily Target 5 | 319.82 |
Daily price and volume Greenply Ind
| Date |
Closing |
Open |
Range |
Volume |
Tue 21 October 2025 |
307.65 (0.46%) |
306.75 |
303.90 - 314.90 |
0.7671 times |
Mon 20 October 2025 |
306.25 (0.64%) |
301.20 |
300.55 - 312.45 |
0.6053 times |
Fri 17 October 2025 |
304.30 (-0.21%) |
304.40 |
303.60 - 309.50 |
0.6985 times |
Thu 16 October 2025 |
304.95 (2.21%) |
299.05 |
299.05 - 306.55 |
0.8005 times |
Wed 15 October 2025 |
298.35 (1.76%) |
294.80 |
294.45 - 301.20 |
0.4051 times |
Tue 14 October 2025 |
293.20 (-0.76%) |
295.55 |
292.85 - 301.25 |
1.1727 times |
Mon 13 October 2025 |
295.45 (1.04%) |
291.00 |
291.00 - 304.90 |
2.7428 times |
Fri 10 October 2025 |
292.40 (0.19%) |
292.20 |
292.00 - 296.60 |
1.363 times |
Thu 09 October 2025 |
291.85 (-0.55%) |
293.30 |
288.90 - 296.60 |
1.0635 times |
Wed 08 October 2025 |
293.45 (-0.37%) |
294.80 |
292.50 - 296.20 |
0.3815 times |
Tue 07 October 2025 |
294.55 (-0.84%) |
298.90 |
293.90 - 299.95 |
1.0128 times |
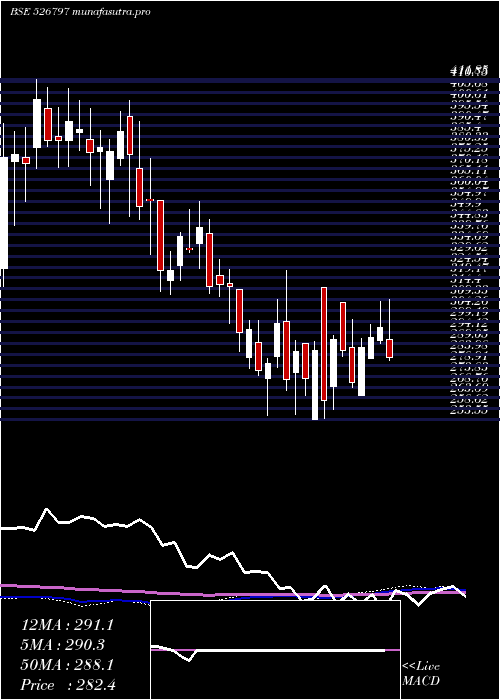
Weekly price and charts GreenplyInd Strong weekly Stock price targets for GreenplyInd 526797 are 304.1 and 318.45 | Weekly Target 1 | 293.35 | | Weekly Target 2 | 300.5 | | Weekly Target 3 | 307.7 | | Weekly Target 4 | 314.85 | | Weekly Target 5 | 322.05 |
Weekly price and volumes for Greenply Ind
| Date |
Closing |
Open |
Range |
Volume |
Tue 21 October 2025 |
307.65 (1.1%) |
301.20 |
300.55 - 314.90 |
0.1544 times |
Fri 17 October 2025 |
304.30 (4.07%) |
291.00 |
291.00 - 309.50 |
0.6548 times |
Fri 10 October 2025 |
292.40 (-2.39%) |
300.00 |
288.90 - 300.00 |
0.4872 times |
Fri 03 October 2025 |
299.55 (-1.92%) |
300.20 |
281.00 - 304.20 |
0.787 times |
Fri 26 September 2025 |
305.40 (-6.1%) |
318.70 |
298.10 - 337.00 |
0.6227 times |
Fri 19 September 2025 |
325.25 (2.09%) |
318.55 |
314.85 - 329.10 |
1.2129 times |
Fri 12 September 2025 |
318.60 (7.73%) |
290.05 |
286.05 - 330.35 |
3.5098 times |
Fri 05 September 2025 |
295.75 (-4.13%) |
310.50 |
295.15 - 315.00 |
0.8902 times |
Fri 29 August 2025 |
308.50 (0.16%) |
309.10 |
296.75 - 319.30 |
0.9544 times |
Fri 22 August 2025 |
308.00 (0.16%) |
319.90 |
303.85 - 319.90 |
0.7266 times |
Thu 14 August 2025 |
307.50 (-0.68%) |
318.95 |
303.05 - 318.95 |
0.3986 times |
Monthly price and charts GreenplyInd Strong monthly Stock price targets for GreenplyInd 526797 are 298.28 and 324.28 | Monthly Target 1 | 277.82 | | Monthly Target 2 | 292.73 | | Monthly Target 3 | 303.81666666667 | | Monthly Target 4 | 318.73 | | Monthly Target 5 | 329.82 |
Monthly price and volumes Greenply Ind
| Date |
Closing |
Open |
Range |
Volume |
Tue 21 October 2025 |
307.65 (2.11%) |
300.00 |
288.90 - 314.90 |
0.3428 times |
Tue 30 September 2025 |
301.30 (-2.33%) |
310.50 |
281.00 - 337.00 |
1.5299 times |
Fri 29 August 2025 |
308.50 (-4.28%) |
318.10 |
296.75 - 331.35 |
0.6785 times |
Thu 31 July 2025 |
322.30 (2.79%) |
315.85 |
280.00 - 351.55 |
1.7346 times |
Mon 30 June 2025 |
313.55 (-3.05%) |
324.85 |
282.05 - 338.30 |
1.0387 times |
Fri 30 May 2025 |
323.40 (11.42%) |
290.40 |
256.30 - 325.95 |
1.26 times |
Wed 30 April 2025 |
290.25 (1.59%) |
287.00 |
264.85 - 309.45 |
1.1093 times |
Fri 28 March 2025 |
285.70 (4.73%) |
253.55 |
253.55 - 314.85 |
0.6585 times |
Fri 28 February 2025 |
272.80 (-2.47%) |
282.90 |
256.00 - 322.90 |
0.7733 times |
Fri 31 January 2025 |
279.70 (-8.92%) |
319.60 |
255.60 - 323.30 |
0.8745 times |
Tue 31 December 2024 |
307.10 (-9.3%) |
333.05 |
298.10 - 355.05 |
2.3336 times |
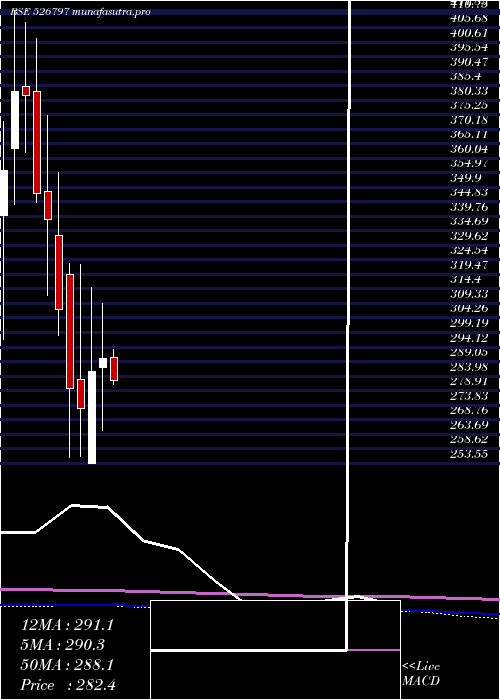
DMA SMA EMA moving averages of Greenply Ind 526797
DMA (daily moving average) of Greenply Ind 526797
| DMA period | DMA value | | 5 day DMA | 304.3 | | 12 day DMA | 298.29 | | 20 day DMA | 301.02 | | 35 day DMA | 305.13 | | 50 day DMA | 306.37 | | 100 day DMA | 312.44 | | 150 day DMA | 303.97 | | 200 day DMA | 300.33 | EMA (exponential moving average) of Greenply Ind 526797
| EMA period | EMA current | EMA prev | EMA prev2 | | 5 day EMA | 304.18 | 302.44 | 300.54 | | 12 day EMA | 301.79 | 300.72 | 299.71 | | 20 day EMA | 302.38 | 301.83 | 301.37 | | 35 day EMA | 303.63 | 303.39 | 303.22 | | 50 day EMA | 306.6 | 306.56 | 306.57 |
SMA (simple moving average) of Greenply Ind 526797
| SMA period | SMA current | SMA prev | SMA prev2 | | 5 day SMA | 304.3 | 301.41 | 299.25 | | 12 day SMA | 298.29 | 297.61 | 296.81 | | 20 day SMA | 301.02 | 301.48 | 302.43 | | 35 day SMA | 305.13 | 305.08 | 305.14 | | 50 day SMA | 306.37 | 306.43 | 306.36 | | 100 day SMA | 312.44 | 312.56 | 312.67 | | 150 day SMA | 303.97 | 303.77 | 303.44 | | 200 day SMA | 300.33 | 300.39 | 300.43 |
|
|
