BrightBros 526731 full analysis,charts,indicators,moving averages,SMA,DMA,EMA,ADX,MACD,RSIBright Bros 526731 WideScreen charts, DMA,SMA,EMA technical analysis, forecast prediction, by indicators ADX,MACD,RSI,CCI BSE stock exchange
Daily price and charts and targets BrightBros Strong Daily Stock price targets for BrightBros 526731 are 272.38 and 289.23 | Daily Target 1 | 259.4 | | Daily Target 2 | 268.5 | | Daily Target 3 | 276.25 | | Daily Target 4 | 285.35 | | Daily Target 5 | 293.1 |
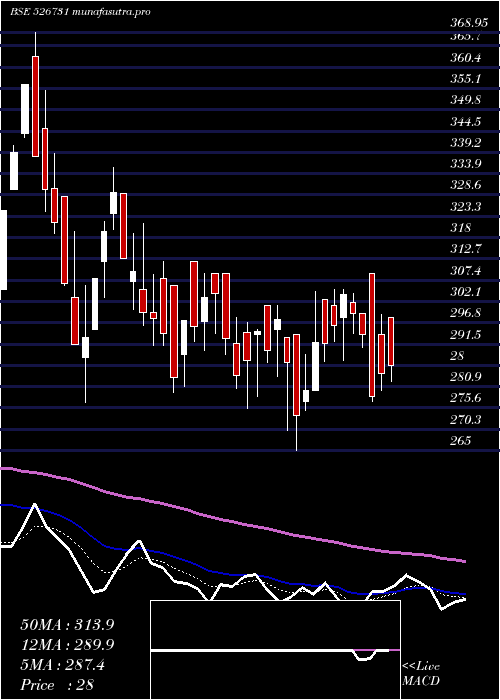
Daily price and volume Bright Bros
| Date |
Closing |
Open |
Range |
Volume |
Fri 05 December 2025 |
277.60 (1.42%) |
267.15 |
267.15 - 284.00 |
2.0271 times |
Thu 04 December 2025 |
273.70 (1.58%) |
283.70 |
270.50 - 283.70 |
0.8423 times |
Wed 03 December 2025 |
269.45 (-3.79%) |
285.00 |
261.90 - 285.00 |
0.9017 times |
Tue 02 December 2025 |
280.05 (1.03%) |
277.30 |
271.65 - 283.00 |
0.2301 times |
Mon 01 December 2025 |
277.20 (-1%) |
280.00 |
276.00 - 281.85 |
1.9223 times |
Fri 28 November 2025 |
280.00 (-0.46%) |
289.90 |
275.00 - 289.90 |
0.5713 times |
Thu 27 November 2025 |
281.30 (-1.47%) |
285.50 |
274.25 - 288.75 |
0.7324 times |
Wed 26 November 2025 |
285.50 (0.63%) |
289.40 |
276.00 - 289.40 |
1.0717 times |
Tue 25 November 2025 |
283.70 (0.07%) |
289.20 |
280.00 - 291.00 |
0.4537 times |
Mon 24 November 2025 |
283.50 (-3.91%) |
290.00 |
281.00 - 304.90 |
1.2474 times |
Fri 21 November 2025 |
295.05 (-1.73%) |
305.00 |
293.25 - 305.00 |
1.181 times |
Weekly price and charts BrightBros Strong weekly Stock price targets for BrightBros 526731 are 258.2 and 281.3 | Weekly Target 1 | 251.73 | | Weekly Target 2 | 264.67 | | Weekly Target 3 | 274.83333333333 | | Weekly Target 4 | 287.77 | | Weekly Target 5 | 297.93 |
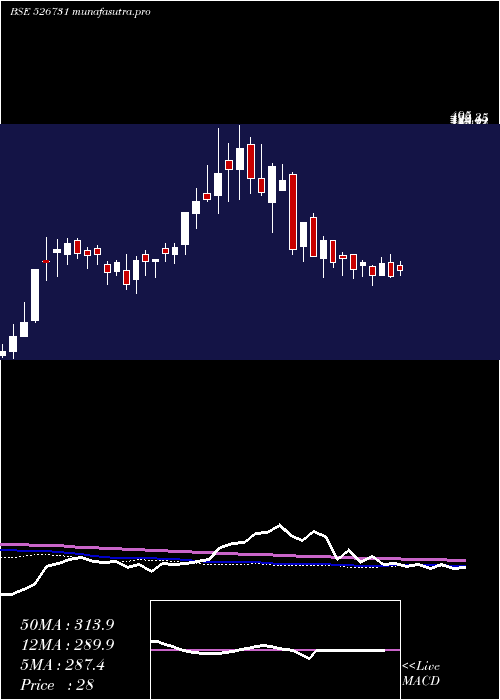
Weekly price and volumes for Bright Bros
| Date |
Closing |
Open |
Range |
Volume |
Fri 05 December 2025 |
277.60 (-0.86%) |
280.00 |
261.90 - 285.00 |
0.6178 times |
Fri 28 November 2025 |
280.00 (-5.1%) |
290.00 |
274.25 - 304.90 |
0.4252 times |
Fri 21 November 2025 |
295.05 (5.47%) |
276.00 |
270.00 - 306.00 |
1.1673 times |
Fri 14 November 2025 |
279.75 (-9.05%) |
327.70 |
275.20 - 328.00 |
2.058 times |
Fri 07 November 2025 |
307.60 (-6.13%) |
334.75 |
301.45 - 340.00 |
1.377 times |
Fri 31 October 2025 |
327.70 (1.82%) |
328.00 |
318.25 - 331.00 |
0.4879 times |
Thu 23 October 2025 |
321.85 (0.64%) |
329.45 |
320.00 - 339.95 |
0.5918 times |
Fri 17 October 2025 |
319.80 (-1.68%) |
325.25 |
315.00 - 332.95 |
1.0016 times |
Fri 10 October 2025 |
325.25 (-1.45%) |
343.95 |
317.00 - 343.95 |
1.1804 times |
Fri 03 October 2025 |
330.05 (-7.16%) |
355.50 |
325.05 - 365.00 |
1.093 times |
Fri 26 September 2025 |
355.50 (6.17%) |
338.90 |
325.10 - 377.20 |
3.9237 times |
Monthly price and charts BrightBros Strong monthly Stock price targets for BrightBros 526731 are 258.2 and 281.3 | Monthly Target 1 | 251.73 | | Monthly Target 2 | 264.67 | | Monthly Target 3 | 274.83333333333 | | Monthly Target 4 | 287.77 | | Monthly Target 5 | 297.93 |
Monthly price and volumes Bright Bros
| Date |
Closing |
Open |
Range |
Volume |
Fri 05 December 2025 |
277.60 (-0.86%) |
280.00 |
261.90 - 285.00 |
0.0891 times |
Fri 28 November 2025 |
280.00 (-14.56%) |
334.75 |
270.00 - 340.00 |
0.7252 times |
Fri 31 October 2025 |
327.70 (-4.1%) |
345.00 |
315.00 - 345.00 |
0.5609 times |
Tue 30 September 2025 |
341.70 (-2.06%) |
365.00 |
325.00 - 377.20 |
1.1823 times |
Fri 29 August 2025 |
348.90 (-2.81%) |
365.00 |
301.95 - 393.00 |
1.3728 times |
Thu 31 July 2025 |
359.00 (4.77%) |
355.00 |
320.00 - 389.00 |
1.5402 times |
Mon 30 June 2025 |
342.65 (0.45%) |
342.75 |
295.00 - 357.00 |
0.803 times |
Fri 30 May 2025 |
341.10 (23.43%) |
276.35 |
264.00 - 374.90 |
1.7011 times |
Wed 30 April 2025 |
276.35 (-3.86%) |
294.00 |
265.00 - 308.95 |
0.594 times |
Fri 28 March 2025 |
287.45 (-6.26%) |
303.10 |
275.55 - 335.50 |
1.4314 times |
Fri 28 February 2025 |
306.65 (-29.71%) |
402.05 |
299.05 - 438.75 |
1.6188 times |

DMA SMA EMA moving averages of Bright Bros 526731
DMA (daily moving average) of Bright Bros 526731
| DMA period | DMA value | | 5 day DMA | 275.6 | | 12 day DMA | 282.28 | | 20 day DMA | 290.43 | | 35 day DMA | 304.02 | | 50 day DMA | 313.38 | | 100 day DMA | 330.1 | | 150 day DMA | 329.35 | | 200 day DMA | 326.42 | EMA (exponential moving average) of Bright Bros 526731
| EMA period | EMA current | EMA prev | EMA prev2 | | 5 day EMA | 276.58 | 276.07 | 277.26 | | 12 day EMA | 282.36 | 283.22 | 284.95 | | 20 day EMA | 289.38 | 290.62 | 292.4 | | 35 day EMA | 300.12 | 301.45 | 303.08 | | 50 day EMA | 311.16 | 312.53 | 314.11 |
SMA (simple moving average) of Bright Bros 526731
| SMA period | SMA current | SMA prev | SMA prev2 | | 5 day SMA | 275.6 | 276.08 | 277.6 | | 12 day SMA | 282.28 | 283.64 | 285.59 | | 20 day SMA | 290.43 | 291.89 | 293.95 | | 35 day SMA | 304.02 | 305.37 | 306.84 | | 50 day SMA | 313.38 | 314.53 | 315.6 | | 100 day SMA | 330.1 | 331.09 | 332.08 | | 150 day SMA | 329.35 | 329.39 | 329.42 | | 200 day SMA | 326.42 | 327.08 | 327.89 |
|
|
