Sandesh 526725 full analysis,charts,indicators,moving averages,SMA,DMA,EMA,ADX,MACD,RSISandesh 526725 WideScreen charts, DMA,SMA,EMA technical analysis, forecast prediction, by indicators ADX,MACD,RSI,CCI BSE stock exchange
Daily price and charts and targets Sandesh Strong Daily Stock price targets for Sandesh 526725 are 1149.95 and 1159.95 | Daily Target 1 | 1141.63 | | Daily Target 2 | 1148.27 | | Daily Target 3 | 1151.6333333333 | | Daily Target 4 | 1158.27 | | Daily Target 5 | 1161.63 |
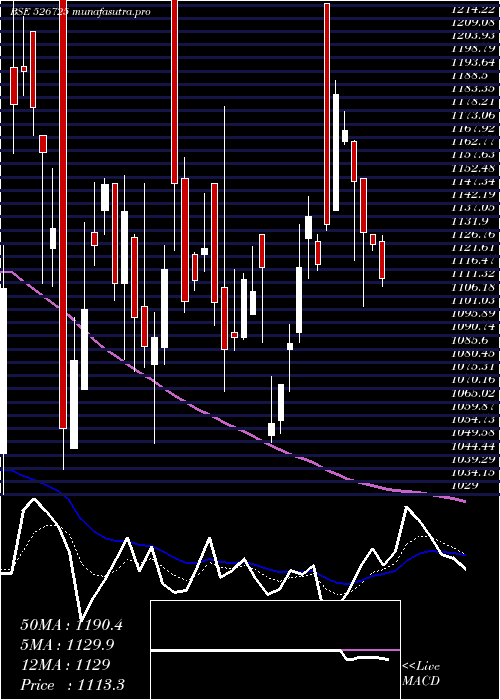
Daily price and volume Sandesh
| Date |
Closing |
Open |
Range |
Volume |
Mon 20 October 2025 |
1154.90 (0.36%) |
1154.30 |
1145.00 - 1155.00 |
1.4503 times |
Fri 17 October 2025 |
1150.80 (-3.36%) |
1177.00 |
1130.30 - 1178.00 |
0.6215 times |
Wed 15 October 2025 |
1190.75 (0.78%) |
1180.00 |
1163.00 - 1190.75 |
0.0829 times |
Tue 14 October 2025 |
1181.55 (1.41%) |
1176.40 |
1162.30 - 1181.55 |
0.3591 times |
Mon 13 October 2025 |
1165.15 (0.11%) |
1180.00 |
1163.00 - 1180.00 |
0.732 times |
Fri 10 October 2025 |
1163.90 (-0.06%) |
1159.30 |
1158.75 - 1186.00 |
0.8564 times |
Thu 09 October 2025 |
1164.55 (-1.55%) |
1182.90 |
1137.10 - 1182.90 |
4.0331 times |
Wed 08 October 2025 |
1182.90 (1.02%) |
1185.80 |
1178.00 - 1185.80 |
0.7735 times |
Tue 07 October 2025 |
1170.90 (-0.35%) |
1178.00 |
1161.05 - 1186.50 |
0.884 times |
Mon 06 October 2025 |
1175.00 (1.12%) |
1175.50 |
1175.00 - 1188.00 |
0.2072 times |
Fri 03 October 2025 |
1162.00 (-1.25%) |
1172.50 |
1157.00 - 1188.40 |
0.5249 times |
Weekly price and charts Sandesh Strong weekly Stock price targets for Sandesh 526725 are 1149.95 and 1159.95 | Weekly Target 1 | 1141.63 | | Weekly Target 2 | 1148.27 | | Weekly Target 3 | 1151.6333333333 | | Weekly Target 4 | 1158.27 | | Weekly Target 5 | 1161.63 |
Weekly price and volumes for Sandesh
| Date |
Closing |
Open |
Range |
Volume |
Mon 20 October 2025 |
1154.90 (0.36%) |
1154.30 |
1145.00 - 1155.00 |
0.208 times |
Fri 17 October 2025 |
1150.80 (-1.13%) |
1180.00 |
1130.30 - 1190.75 |
0.2575 times |
Fri 10 October 2025 |
1163.90 (0.16%) |
1175.50 |
1137.10 - 1188.00 |
0.9685 times |
Fri 03 October 2025 |
1162.00 (-1.4%) |
1273.95 |
1157.00 - 1273.95 |
1.2656 times |
Fri 26 September 2025 |
1178.45 (-2.1%) |
1200.30 |
1129.00 - 1230.20 |
0.8259 times |
Fri 19 September 2025 |
1203.70 (0.24%) |
1206.30 |
1180.00 - 1251.00 |
0.6813 times |
Fri 12 September 2025 |
1200.85 (-1.48%) |
1229.50 |
1170.00 - 1232.80 |
0.6397 times |
Fri 05 September 2025 |
1218.90 (2.64%) |
1155.45 |
1155.45 - 1299.00 |
1.9073 times |
Fri 29 August 2025 |
1187.50 (-5.09%) |
1251.15 |
1166.90 - 1251.15 |
1.6756 times |
Fri 22 August 2025 |
1251.15 (-2.99%) |
1302.90 |
1243.00 - 1302.90 |
1.5706 times |
Thu 14 August 2025 |
1289.75 (-5.59%) |
1366.00 |
1256.00 - 1499.95 |
9.3821 times |

Monthly price and charts Sandesh Strong monthly Stock price targets for Sandesh 526725 are 1106.75 and 1178.45 | Monthly Target 1 | 1090.7 | | Monthly Target 2 | 1122.8 | | Monthly Target 3 | 1162.4 | | Monthly Target 4 | 1194.5 | | Monthly Target 5 | 1234.1 |
Monthly price and volumes Sandesh
| Date |
Closing |
Open |
Range |
Volume |
Mon 20 October 2025 |
1154.90 (-0.95%) |
1179.65 |
1130.30 - 1202.00 |
0.159 times |
Tue 30 September 2025 |
1166.00 (-1.81%) |
1155.45 |
1129.00 - 1299.00 |
0.4046 times |
Fri 29 August 2025 |
1187.50 (1.5%) |
1169.20 |
1138.80 - 1499.95 |
3.8235 times |
Thu 31 July 2025 |
1170.00 (0.77%) |
1157.25 |
1112.50 - 1218.90 |
0.4255 times |
Mon 30 June 2025 |
1161.05 (-3.24%) |
1175.15 |
1111.00 - 1247.00 |
0.5532 times |
Fri 30 May 2025 |
1199.95 (7.79%) |
1109.85 |
1010.00 - 1244.95 |
0.6131 times |
Wed 30 April 2025 |
1113.25 (2.12%) |
1090.10 |
1049.15 - 1219.95 |
0.3243 times |
Fri 28 March 2025 |
1090.10 (-3.76%) |
1226.90 |
1038.95 - 1295.00 |
1.7779 times |
Fri 28 February 2025 |
1132.70 (-23.09%) |
1437.25 |
1000.00 - 1553.95 |
1.4233 times |
Fri 31 January 2025 |
1472.80 (-7.99%) |
1616.95 |
1363.55 - 1875.00 |
0.4955 times |
Tue 31 December 2024 |
1600.75 (-0.08%) |
1622.35 |
1501.35 - 1771.95 |
0.7749 times |

DMA SMA EMA moving averages of Sandesh 526725
DMA (daily moving average) of Sandesh 526725
| DMA period | DMA value | | 5 day DMA | 1168.63 | | 12 day DMA | 1169.92 | | 20 day DMA | 1176.1 | | 35 day DMA | 1190.13 | | 50 day DMA | 1220.03 | | 100 day DMA | 1194.1 | | 150 day DMA | 1174.2 | | 200 day DMA | 1241.86 | EMA (exponential moving average) of Sandesh 526725
| EMA period | EMA current | EMA prev | EMA prev2 | | 5 day EMA | 1164.5 | 1169.3 | 1178.55 | | 12 day EMA | 1170.57 | 1173.42 | 1177.53 | | 20 day EMA | 1177.64 | 1180.03 | 1183.1 | | 35 day EMA | 1193.62 | 1195.9 | 1198.56 | | 50 day EMA | 1210.36 | 1212.62 | 1215.14 |
SMA (simple moving average) of Sandesh 526725
| SMA period | SMA current | SMA prev | SMA prev2 | | 5 day SMA | 1168.63 | 1170.43 | 1173.18 | | 12 day SMA | 1169.92 | 1170.85 | 1172.28 | | 20 day SMA | 1176.1 | 1178.61 | 1181.42 | | 35 day SMA | 1190.13 | 1191.69 | 1193.51 | | 50 day SMA | 1220.03 | 1220.08 | 1220.33 | | 100 day SMA | 1194.1 | 1194.83 | 1195.5 | | 150 day SMA | 1174.2 | 1173.54 | 1173.42 | | 200 day SMA | 1241.86 | 1244.45 | 1247.25 |
|
|
