GopalaPoly 526717 full analysis,charts,indicators,moving averages,SMA,DMA,EMA,ADX,MACD,RSIGopala Poly 526717 WideScreen charts, DMA,SMA,EMA technical analysis, forecast prediction, by indicators ADX,MACD,RSI,CCI BSE stock exchange
Daily price and charts and targets GopalaPoly Strong Daily Stock price targets for GopalaPoly 526717 are 187.2 and 193.15 | Daily Target 1 | 182.5 | | Daily Target 2 | 185.95 | | Daily Target 3 | 188.45 | | Daily Target 4 | 191.9 | | Daily Target 5 | 194.4 |
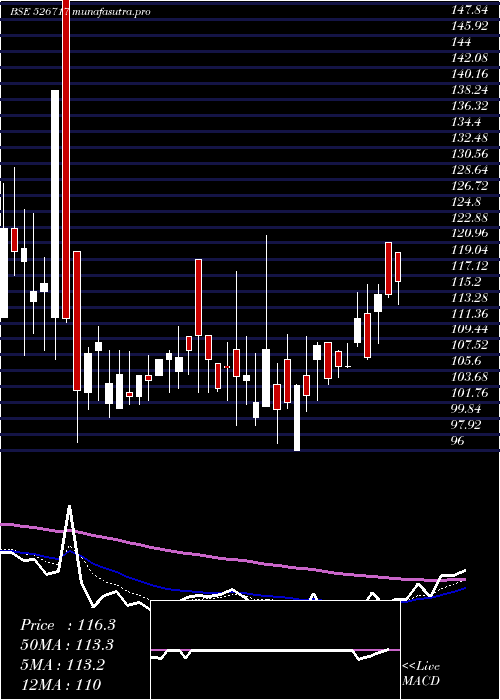
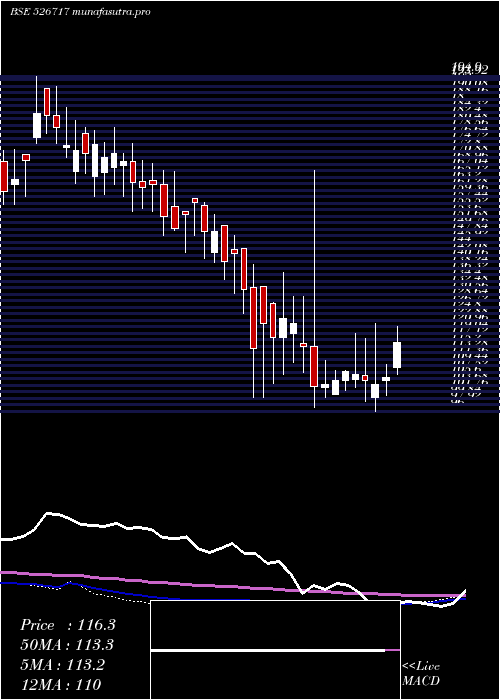
Daily price and volume Gopala Poly
| Date |
Closing |
Open |
Range |
Volume |
Fri 05 December 2025 |
189.40 (1.31%) |
186.95 |
185.00 - 190.95 |
1.6671 times |
Thu 04 December 2025 |
186.95 (-3.58%) |
188.00 |
184.25 - 189.45 |
3.2456 times |
Wed 03 December 2025 |
193.90 (0.18%) |
196.85 |
187.55 - 196.85 |
0.2215 times |
Tue 02 December 2025 |
193.55 (1.2%) |
194.00 |
190.10 - 197.00 |
0.291 times |
Mon 01 December 2025 |
191.25 (-0.65%) |
200.95 |
190.00 - 200.95 |
0.8701 times |
Fri 28 November 2025 |
192.50 (4.99%) |
183.00 |
183.00 - 192.50 |
0.9407 times |
Thu 27 November 2025 |
183.35 (4.06%) |
174.45 |
171.15 - 184.00 |
0.2921 times |
Wed 26 November 2025 |
176.20 (1.38%) |
166.25 |
165.15 - 177.00 |
0.8185 times |
Tue 25 November 2025 |
173.80 (-3.92%) |
172.10 |
171.90 - 180.00 |
1.2003 times |
Mon 24 November 2025 |
180.90 (-3.11%) |
186.70 |
180.00 - 194.45 |
0.4531 times |
Fri 21 November 2025 |
186.70 (-0.43%) |
187.50 |
184.00 - 187.50 |
1.2378 times |
Weekly price and charts GopalaPoly Strong weekly Stock price targets for GopalaPoly 526717 are 178.48 and 195.18 | Weekly Target 1 | 174.83 | | Weekly Target 2 | 182.12 | | Weekly Target 3 | 191.53333333333 | | Weekly Target 4 | 198.82 | | Weekly Target 5 | 208.23 |
Weekly price and volumes for Gopala Poly
| Date |
Closing |
Open |
Range |
Volume |
Fri 05 December 2025 |
189.40 (-1.61%) |
200.95 |
184.25 - 200.95 |
1.2704 times |
Fri 28 November 2025 |
192.50 (3.11%) |
186.70 |
165.15 - 194.45 |
0.7476 times |
Fri 21 November 2025 |
186.70 (-0.4%) |
184.00 |
178.10 - 201.00 |
1.3582 times |
Fri 14 November 2025 |
187.45 (20.08%) |
159.45 |
159.45 - 206.50 |
2.4432 times |
Fri 07 November 2025 |
156.10 (-4.56%) |
155.05 |
150.00 - 165.50 |
2.1181 times |
Fri 31 October 2025 |
163.55 (-7.49%) |
187.00 |
150.00 - 188.00 |
1.7327 times |
Thu 23 October 2025 |
176.80 (4.96%) |
170.00 |
165.00 - 194.45 |
0.0749 times |
Fri 17 October 2025 |
168.45 (-2.85%) |
174.25 |
161.00 - 177.90 |
0.1203 times |
Fri 10 October 2025 |
173.40 (0.43%) |
165.50 |
158.05 - 184.40 |
0.1046 times |
Fri 03 October 2025 |
172.65 (1.98%) |
169.30 |
160.15 - 177.60 |
0.0301 times |
Fri 26 September 2025 |
169.30 (0.03%) |
162.20 |
162.20 - 180.00 |
0.1398 times |
Monthly price and charts GopalaPoly Strong monthly Stock price targets for GopalaPoly 526717 are 178.48 and 195.18 | Monthly Target 1 | 174.83 | | Monthly Target 2 | 182.12 | | Monthly Target 3 | 191.53333333333 | | Monthly Target 4 | 198.82 | | Monthly Target 5 | 208.23 |
Monthly price and volumes Gopala Poly
| Date |
Closing |
Open |
Range |
Volume |
Fri 05 December 2025 |
189.40 (-1.61%) |
200.95 |
184.25 - 200.95 |
0.2728 times |
Fri 28 November 2025 |
192.50 (17.7%) |
155.05 |
150.00 - 206.50 |
1.4316 times |
Fri 31 October 2025 |
163.55 (-1.48%) |
160.15 |
150.00 - 194.45 |
0.4403 times |
Tue 30 September 2025 |
166.00 (-3.18%) |
170.10 |
157.50 - 180.00 |
0.2205 times |
Fri 29 August 2025 |
171.45 (-16.95%) |
200.40 |
165.65 - 215.95 |
0.1937 times |
Thu 31 July 2025 |
206.45 (21.44%) |
170.00 |
163.50 - 215.35 |
3.6639 times |
Mon 30 June 2025 |
170.00 (-3.85%) |
190.00 |
152.15 - 190.00 |
0.2925 times |
Fri 30 May 2025 |
176.80 (68.46%) |
104.45 |
96.00 - 177.45 |
0.9743 times |
Wed 30 April 2025 |
104.95 (1.6%) |
103.00 |
99.00 - 119.00 |
0.1414 times |
Fri 28 March 2025 |
103.30 (-12.38%) |
117.90 |
97.05 - 167.15 |
2.369 times |
Fri 28 February 2025 |
117.90 (-17.32%) |
144.00 |
100.10 - 144.00 |
0.0721 times |

DMA SMA EMA moving averages of Gopala Poly 526717
DMA (daily moving average) of Gopala Poly 526717
| DMA period | DMA value | | 5 day DMA | 191.01 | | 12 day DMA | 186.33 | | 20 day DMA | 182.29 | | 35 day DMA | 175.75 | | 50 day DMA | 173.58 | | 100 day DMA | 177.75 | | 150 day DMA | 167.06 | | 200 day DMA | 155.12 | EMA (exponential moving average) of Gopala Poly 526717
| EMA period | EMA current | EMA prev | EMA prev2 | | 5 day EMA | 189.39 | 189.39 | 190.61 | | 12 day EMA | 186.41 | 185.87 | 185.67 | | 20 day EMA | 182.99 | 182.32 | 181.83 | | 35 day EMA | 179.09 | 178.48 | 177.98 | | 50 day EMA | 174.78 | 174.18 | 173.66 |
SMA (simple moving average) of Gopala Poly 526717
| SMA period | SMA current | SMA prev | SMA prev2 | | 5 day SMA | 191.01 | 191.63 | 190.91 | | 12 day SMA | 186.33 | 186 | 185.26 | | 20 day SMA | 182.29 | 180.57 | 178.86 | | 35 day SMA | 175.75 | 175.12 | 174.73 | | 50 day SMA | 173.58 | 173.18 | 172.83 | | 100 day SMA | 177.75 | 177.59 | 177.49 | | 150 day SMA | 167.06 | 166.51 | 166 | | 200 day SMA | 155.12 | 154.88 | 154.67 |
|
|
