NatPlastic 526616 full analysis,charts,indicators,moving averages,SMA,DMA,EMA,ADX,MACD,RSINat Plastic 526616 WideScreen charts, DMA,SMA,EMA technical analysis, forecast prediction, by indicators ADX,MACD,RSI,CCI BSE stock exchange
Daily price and charts and targets NatPlastic Strong Daily Stock price targets for NatPlastic 526616 are 54.16 and 57.37 | Daily Target 1 | 53.56 | | Daily Target 2 | 54.75 | | Daily Target 3 | 56.77 | | Daily Target 4 | 57.96 | | Daily Target 5 | 59.98 |
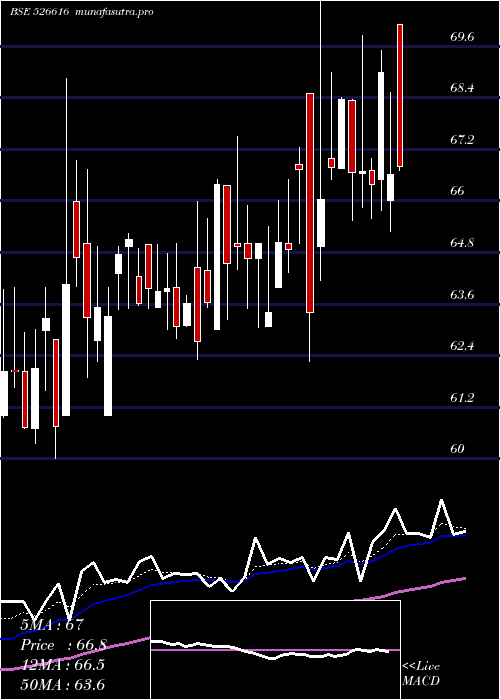
Daily price and volume Nat Plastic
| Date |
Closing |
Open |
Range |
Volume |
Thu 23 October 2025 |
55.94 (0.65%) |
58.79 |
55.58 - 58.79 |
0.6401 times |
Tue 21 October 2025 |
55.58 (-1.05%) |
58.80 |
55.36 - 58.80 |
0.6346 times |
Mon 20 October 2025 |
56.17 (1.48%) |
56.91 |
55.50 - 56.91 |
1.4971 times |
Fri 17 October 2025 |
55.35 (-1.84%) |
60.24 |
55.10 - 60.24 |
3.6103 times |
Thu 16 October 2025 |
56.39 (-2.76%) |
59.30 |
56.25 - 59.30 |
0.7966 times |
Wed 15 October 2025 |
57.99 (4.2%) |
59.69 |
57.99 - 59.69 |
0.7431 times |
Tue 14 October 2025 |
55.65 (-1.15%) |
56.30 |
55.65 - 56.82 |
0.2051 times |
Mon 13 October 2025 |
56.30 (-0.74%) |
55.17 |
55.16 - 57.00 |
1.2055 times |
Fri 10 October 2025 |
56.72 (0.21%) |
56.76 |
56.23 - 57.00 |
0.5921 times |
Thu 09 October 2025 |
56.60 (-0.77%) |
57.90 |
56.60 - 57.90 |
0.0755 times |
Wed 08 October 2025 |
57.04 (0.96%) |
56.60 |
56.60 - 59.50 |
0.4453 times |
Weekly price and charts NatPlastic Strong weekly Stock price targets for NatPlastic 526616 are 53.93 and 57.37 | Weekly Target 1 | 53.26 | | Weekly Target 2 | 54.6 | | Weekly Target 3 | 56.7 | | Weekly Target 4 | 58.04 | | Weekly Target 5 | 60.14 |
Weekly price and volumes for Nat Plastic
| Date |
Closing |
Open |
Range |
Volume |
Thu 23 October 2025 |
55.94 (1.07%) |
56.91 |
55.36 - 58.80 |
0.5142 times |
Fri 17 October 2025 |
55.35 (-2.42%) |
55.17 |
55.10 - 60.24 |
1.217 times |
Fri 10 October 2025 |
56.72 (-2.88%) |
58.40 |
56.15 - 59.50 |
0.4452 times |
Fri 03 October 2025 |
58.40 (2.38%) |
57.30 |
56.50 - 59.00 |
0.6404 times |
Fri 26 September 2025 |
57.04 (-2.16%) |
59.98 |
57.00 - 59.98 |
1.017 times |
Fri 19 September 2025 |
58.30 (-2.43%) |
59.15 |
57.42 - 61.85 |
1.099 times |
Fri 12 September 2025 |
59.75 (-0.98%) |
60.36 |
59.00 - 62.20 |
1.9704 times |
Fri 05 September 2025 |
60.34 (-2.41%) |
61.85 |
59.50 - 64.74 |
0.9741 times |
Fri 29 August 2025 |
61.83 (-1.81%) |
64.00 |
61.19 - 65.75 |
0.8219 times |
Fri 22 August 2025 |
62.97 (-4.88%) |
66.00 |
62.32 - 67.00 |
1.3008 times |
Thu 14 August 2025 |
66.20 (4.19%) |
63.51 |
63.00 - 70.10 |
0.826 times |

Monthly price and charts NatPlastic Strong monthly Stock price targets for NatPlastic 526616 are 52.95 and 58.09 | Monthly Target 1 | 51.95 | | Monthly Target 2 | 53.95 | | Monthly Target 3 | 57.093333333333 | | Monthly Target 4 | 59.09 | | Monthly Target 5 | 62.23 |
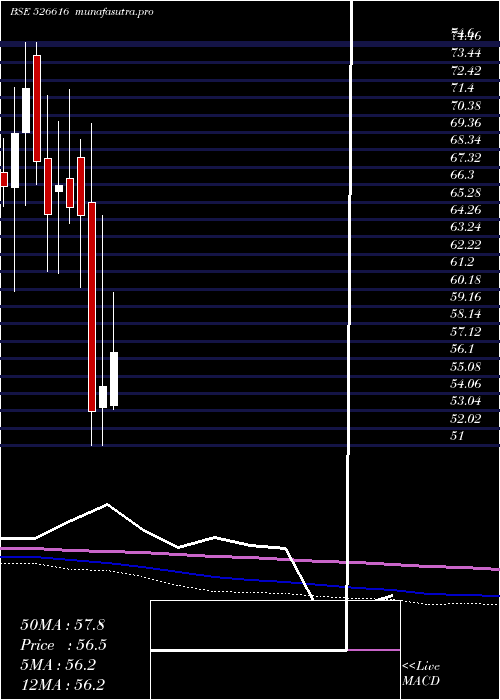
Monthly price and volumes Nat Plastic
| Date |
Closing |
Open |
Range |
Volume |
Thu 23 October 2025 |
55.94 (-0.99%) |
57.65 |
55.10 - 60.24 |
0.2708 times |
Tue 30 September 2025 |
56.50 (-8.62%) |
61.85 |
56.50 - 64.74 |
0.5654 times |
Fri 29 August 2025 |
61.83 (-7.18%) |
70.10 |
61.19 - 70.10 |
0.4308 times |
Thu 31 July 2025 |
66.61 (4.24%) |
63.90 |
62.25 - 72.00 |
1.6072 times |
Mon 30 June 2025 |
63.90 (7.09%) |
60.48 |
58.70 - 68.85 |
1.6938 times |
Fri 30 May 2025 |
59.67 (10.6%) |
55.00 |
51.02 - 60.00 |
1.2819 times |
Wed 30 April 2025 |
53.95 (-0.9%) |
53.35 |
53.15 - 60.00 |
1.212 times |
Fri 28 March 2025 |
54.44 (2.68%) |
53.25 |
51.00 - 64.49 |
1.3579 times |
Fri 28 February 2025 |
53.02 (-17.79%) |
65.27 |
51.00 - 69.87 |
0.763 times |
Fri 31 January 2025 |
64.49 (-0.69%) |
67.89 |
60.26 - 68.95 |
0.8171 times |
Tue 31 December 2024 |
64.94 (-1.99%) |
66.66 |
64.03 - 71.88 |
1.3067 times |
DMA SMA EMA moving averages of Nat Plastic 526616
DMA (daily moving average) of Nat Plastic 526616
| DMA period | DMA value | | 5 day DMA | 55.89 | | 12 day DMA | 56.35 | | 20 day DMA | 56.72 | | 35 day DMA | 57.98 | | 50 day DMA | 59.61 | | 100 day DMA | 61.87 | | 150 day DMA | 59.82 | | 200 day DMA | 60.27 | EMA (exponential moving average) of Nat Plastic 526616
| EMA period | EMA current | EMA prev | EMA prev2 | | 5 day EMA | 55.99 | 56.01 | 56.23 | | 12 day EMA | 56.4 | 56.48 | 56.64 | | 20 day EMA | 56.95 | 57.06 | 57.22 | | 35 day EMA | 58.27 | 58.41 | 58.58 | | 50 day EMA | 59.65 | 59.8 | 59.97 |
SMA (simple moving average) of Nat Plastic 526616
| SMA period | SMA current | SMA prev | SMA prev2 | | 5 day SMA | 55.89 | 56.3 | 56.31 | | 12 day SMA | 56.35 | 56.4 | 56.63 | | 20 day SMA | 56.72 | 56.81 | 56.96 | | 35 day SMA | 57.98 | 58.1 | 58.25 | | 50 day SMA | 59.61 | 59.76 | 59.93 | | 100 day SMA | 61.87 | 61.89 | 61.92 | | 150 day SMA | 59.82 | 59.81 | 59.81 | | 200 day SMA | 60.27 | 60.32 | 60.38 |
|
|
