ExpoGas 526614 full analysis,charts,indicators,moving averages,SMA,DMA,EMA,ADX,MACD,RSIExpo Gas 526614 WideScreen charts, DMA,SMA,EMA technical analysis, forecast prediction, by indicators ADX,MACD,RSI,CCI BSE stock exchange
Daily price and charts and targets ExpoGas Strong Daily Stock price targets for ExpoGas 526614 are 81.73 and 85.23 | Daily Target 1 | 79.2 | | Daily Target 2 | 80.75 | | Daily Target 3 | 82.7 | | Daily Target 4 | 84.25 | | Daily Target 5 | 86.2 |
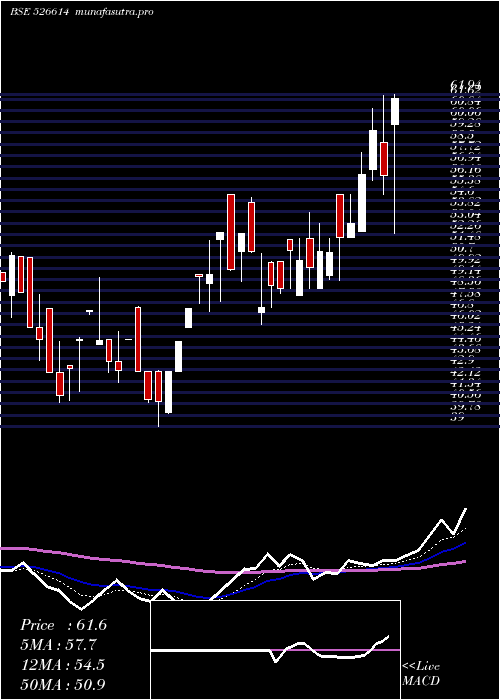
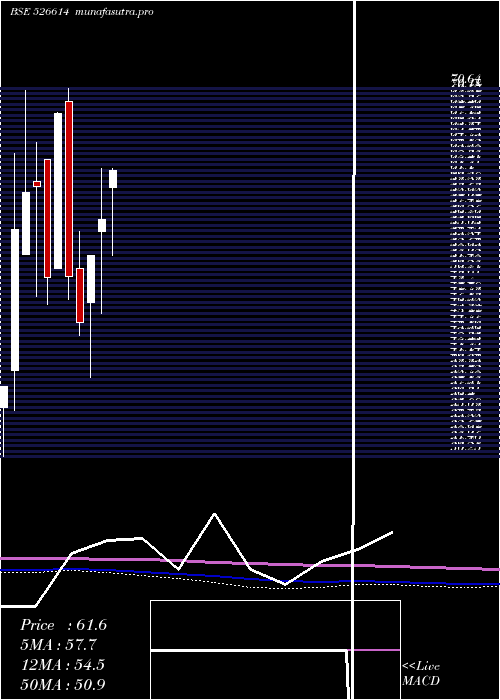
Daily price and volume Expo Gas
| Date |
Closing |
Open |
Range |
Volume |
Thu 23 October 2025 |
82.30 (0.98%) |
81.15 |
81.15 - 84.65 |
0.2782 times |
Tue 21 October 2025 |
81.50 (-2.04%) |
86.00 |
80.80 - 86.00 |
0.2404 times |
Mon 20 October 2025 |
83.20 (2.4%) |
81.25 |
81.25 - 85.90 |
0.5048 times |
Fri 17 October 2025 |
81.25 (-3.27%) |
80.60 |
80.60 - 86.90 |
1.0353 times |
Thu 16 October 2025 |
84.00 (2.31%) |
82.10 |
80.15 - 86.20 |
0.6669 times |
Wed 15 October 2025 |
82.10 (-5.47%) |
91.00 |
81.25 - 91.00 |
1.5087 times |
Tue 14 October 2025 |
86.85 (-2.91%) |
94.40 |
86.15 - 97.00 |
1.4882 times |
Mon 13 October 2025 |
89.45 (-4.89%) |
85.30 |
84.65 - 92.50 |
1.9381 times |
Fri 10 October 2025 |
94.05 (1.29%) |
95.00 |
90.30 - 97.00 |
1.5686 times |
Thu 09 October 2025 |
92.85 (2.65%) |
88.45 |
88.45 - 93.90 |
0.7709 times |
Wed 08 October 2025 |
90.45 (-7.09%) |
97.10 |
90.05 - 100.00 |
2.4402 times |
Weekly price and charts ExpoGas Strong weekly Stock price targets for ExpoGas 526614 are 81.55 and 86.75 | Weekly Target 1 | 77.83 | | Weekly Target 2 | 80.07 | | Weekly Target 3 | 83.033333333333 | | Weekly Target 4 | 85.27 | | Weekly Target 5 | 88.23 |
Weekly price and volumes for Expo Gas
| Date |
Closing |
Open |
Range |
Volume |
Thu 23 October 2025 |
82.30 (1.29%) |
81.25 |
80.80 - 86.00 |
0.1192 times |
Fri 17 October 2025 |
81.25 (-13.61%) |
85.30 |
80.15 - 97.00 |
0.7729 times |
Fri 10 October 2025 |
94.05 (-6.84%) |
105.00 |
88.45 - 105.00 |
0.6332 times |
Fri 03 October 2025 |
100.95 (-3.04%) |
105.80 |
97.00 - 108.00 |
0.4396 times |
Fri 26 September 2025 |
104.12 (7.8%) |
96.11 |
95.00 - 111.00 |
1.8311 times |
Fri 19 September 2025 |
96.59 (3.88%) |
91.80 |
88.00 - 103.00 |
2.2857 times |
Fri 12 September 2025 |
92.98 (2.95%) |
90.32 |
90.20 - 103.40 |
0.7691 times |
Fri 05 September 2025 |
90.32 (10.4%) |
88.00 |
84.04 - 105.00 |
1.5853 times |
Fri 29 August 2025 |
81.81 (-2.11%) |
77.20 |
77.20 - 89.00 |
0.643 times |
Fri 22 August 2025 |
83.57 (6.24%) |
78.66 |
76.01 - 90.00 |
0.921 times |
Thu 14 August 2025 |
78.66 (6.72%) |
73.00 |
70.50 - 81.40 |
2.6873 times |

Monthly price and charts ExpoGas Strong monthly Stock price targets for ExpoGas 526614 are 68.05 and 94.4 | Monthly Target 1 | 63.3 | | Monthly Target 2 | 72.8 | | Monthly Target 3 | 89.65 | | Monthly Target 4 | 99.15 | | Monthly Target 5 | 116 |
Monthly price and volumes Expo Gas
| Date |
Closing |
Open |
Range |
Volume |
Thu 23 October 2025 |
82.30 (-19.27%) |
106.50 |
80.15 - 106.50 |
0.2382 times |
Tue 30 September 2025 |
101.95 (24.62%) |
88.00 |
84.04 - 111.00 |
0.9737 times |
Fri 29 August 2025 |
81.81 (16.95%) |
69.69 |
66.46 - 90.00 |
0.9486 times |
Thu 31 July 2025 |
69.95 (11.49%) |
63.90 |
62.43 - 74.60 |
0.8515 times |
Mon 30 June 2025 |
62.74 (-9.13%) |
70.28 |
60.32 - 75.50 |
0.7203 times |
Fri 30 May 2025 |
69.04 (22.61%) |
59.85 |
52.36 - 77.55 |
3.5366 times |
Wed 30 April 2025 |
56.31 (7.46%) |
55.02 |
46.03 - 61.90 |
0.9217 times |
Fri 28 March 2025 |
52.40 (16.44%) |
47.15 |
39.00 - 52.40 |
0.3476 times |
Fri 28 February 2025 |
45.00 (-9.98%) |
50.95 |
43.55 - 54.95 |
0.6654 times |
Fri 31 January 2025 |
49.99 (-26.39%) |
69.26 |
47.50 - 70.64 |
0.7964 times |
Tue 31 December 2024 |
67.91 (35.9%) |
50.96 |
50.96 - 68.00 |
0.5134 times |
DMA SMA EMA moving averages of Expo Gas 526614
DMA (daily moving average) of Expo Gas 526614
| DMA period | DMA value | | 5 day DMA | 82.45 | | 12 day DMA | 87.11 | | 20 day DMA | 93.22 | | 35 day DMA | 94.51 | | 50 day DMA | 91.33 | | 100 day DMA | 79.86 | | 150 day DMA | 71.5 | | 200 day DMA | 67.07 | EMA (exponential moving average) of Expo Gas 526614
| EMA period | EMA current | EMA prev | EMA prev2 | | 5 day EMA | 83.02 | 83.38 | 84.32 | | 12 day EMA | 86.79 | 87.61 | 88.72 | | 20 day EMA | 89.35 | 90.09 | 90.99 | | 35 day EMA | 89.54 | 89.97 | 90.47 | | 50 day EMA | 88.85 | 89.12 | 89.43 |
SMA (simple moving average) of Expo Gas 526614
| SMA period | SMA current | SMA prev | SMA prev2 | | 5 day SMA | 82.45 | 82.41 | 83.48 | | 12 day SMA | 87.11 | 88.5 | 90.12 | | 20 day SMA | 93.22 | 94.45 | 95.25 | | 35 day SMA | 94.51 | 94.95 | 95.17 | | 50 day SMA | 91.33 | 91.16 | 91 | | 100 day SMA | 79.86 | 79.7 | 79.51 | | 150 day SMA | 71.5 | 71.25 | 71 | | 200 day SMA | 67.07 | 66.97 | 66.89 |
|
|
