SanghiInd 526521 full analysis,charts,indicators,moving averages,SMA,DMA,EMA,ADX,MACD,RSISanghi Ind 526521 WideScreen charts, DMA,SMA,EMA technical analysis, forecast prediction, by indicators ADX,MACD,RSI,CCI BSE stock exchange
Daily price and charts and targets SanghiInd Strong Daily Stock price targets for SanghiInd 526521 are 63.99 and 64.72 | Daily Target 1 | 63.83 | | Daily Target 2 | 64.15 | | Daily Target 3 | 64.556666666667 | | Daily Target 4 | 64.88 | | Daily Target 5 | 65.29 |
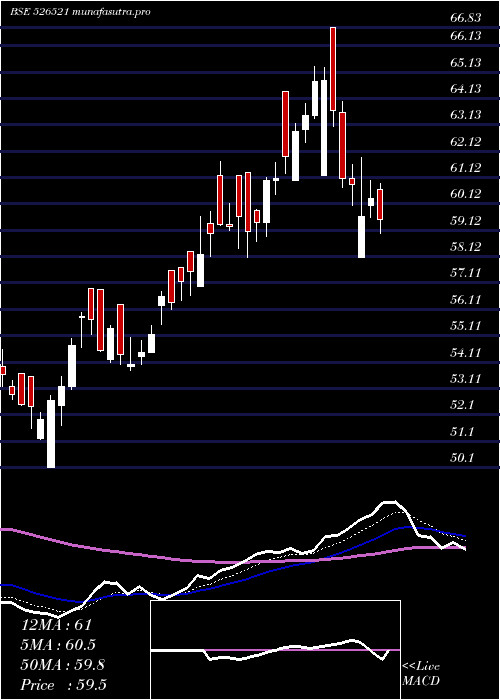
Daily price and volume Sanghi Ind
| Date |
Closing |
Open |
Range |
Volume |
Thu 23 October 2025 |
64.48 (-0.37%) |
64.85 |
64.23 - 64.96 |
0.68 times |
Tue 21 October 2025 |
64.72 (0.37%) |
64.06 |
64.06 - 65.40 |
0.6037 times |
Mon 20 October 2025 |
64.48 (0.45%) |
63.05 |
63.05 - 66.00 |
1.8922 times |
Fri 17 October 2025 |
64.19 (-1.08%) |
64.82 |
63.61 - 64.82 |
0.2773 times |
Thu 16 October 2025 |
64.89 (1.41%) |
64.66 |
64.07 - 65.00 |
0.518 times |
Wed 15 October 2025 |
63.99 (0.05%) |
62.25 |
62.25 - 64.80 |
1.1488 times |
Tue 14 October 2025 |
63.96 (-0.11%) |
64.03 |
62.79 - 64.07 |
0.4042 times |
Mon 13 October 2025 |
64.03 (-0.5%) |
64.29 |
63.79 - 64.29 |
0.5699 times |
Fri 10 October 2025 |
64.35 (0.66%) |
64.10 |
63.94 - 64.59 |
2.8472 times |
Thu 09 October 2025 |
63.93 (-0.23%) |
64.00 |
63.57 - 64.13 |
1.0589 times |
Wed 08 October 2025 |
64.08 (-0.31%) |
64.31 |
63.14 - 64.41 |
0.4781 times |
Weekly price and charts SanghiInd Strong weekly Stock price targets for SanghiInd 526521 are 63.77 and 66.72 | Weekly Target 1 | 61.56 | | Weekly Target 2 | 63.02 | | Weekly Target 3 | 64.51 | | Weekly Target 4 | 65.97 | | Weekly Target 5 | 67.46 |
Weekly price and volumes for Sanghi Ind
| Date |
Closing |
Open |
Range |
Volume |
Thu 23 October 2025 |
64.48 (0.45%) |
63.05 |
63.05 - 66.00 |
0.473 times |
Fri 17 October 2025 |
64.19 (-0.25%) |
64.29 |
62.25 - 65.00 |
0.4346 times |
Fri 10 October 2025 |
64.35 (-1.27%) |
65.20 |
63.14 - 65.37 |
1.058 times |
Fri 03 October 2025 |
65.18 (1.65%) |
64.16 |
62.91 - 67.00 |
0.9671 times |
Fri 26 September 2025 |
64.12 (-2.18%) |
65.55 |
63.51 - 71.80 |
1.9876 times |
Fri 19 September 2025 |
65.55 (3.23%) |
63.00 |
63.00 - 66.85 |
1.5072 times |
Fri 12 September 2025 |
63.50 (-1%) |
63.85 |
62.60 - 65.65 |
0.9198 times |
Fri 05 September 2025 |
64.14 (2.1%) |
63.49 |
63.05 - 66.50 |
0.9819 times |
Fri 29 August 2025 |
62.82 (-4.41%) |
65.69 |
62.48 - 67.00 |
0.2823 times |
Fri 22 August 2025 |
65.72 (2.19%) |
66.00 |
64.44 - 67.73 |
1.3886 times |
Thu 14 August 2025 |
64.31 (-1.18%) |
65.62 |
63.14 - 66.25 |
1.1503 times |
Monthly price and charts SanghiInd Strong monthly Stock price targets for SanghiInd 526521 are 61.49 and 65.24 | Monthly Target 1 | 60.49 | | Monthly Target 2 | 62.49 | | Monthly Target 3 | 64.243333333333 | | Monthly Target 4 | 66.24 | | Monthly Target 5 | 67.99 |
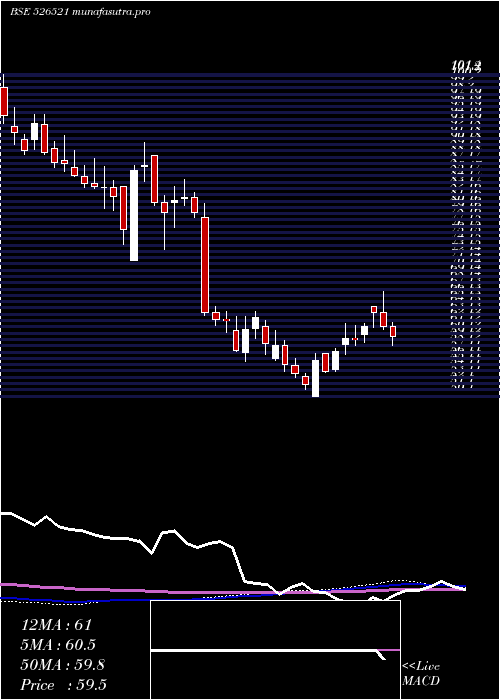
Monthly price and volumes Sanghi Ind
| Date |
Closing |
Open |
Range |
Volume |
Thu 23 October 2025 |
64.48 (0.23%) |
64.65 |
62.25 - 66.00 |
0.2355 times |
Tue 30 September 2025 |
64.33 (2.4%) |
63.49 |
62.60 - 71.80 |
0.5945 times |
Fri 29 August 2025 |
62.82 (-5.19%) |
70.00 |
62.48 - 70.80 |
0.3713 times |
Thu 31 July 2025 |
66.26 (3.26%) |
63.80 |
63.60 - 70.56 |
1.0467 times |
Mon 30 June 2025 |
64.17 (3.97%) |
61.12 |
58.50 - 64.51 |
0.8176 times |
Fri 30 May 2025 |
61.72 (2.29%) |
60.65 |
53.40 - 66.50 |
0.9017 times |
Wed 30 April 2025 |
60.34 (1.69%) |
59.34 |
58.08 - 66.83 |
0.739 times |
Fri 28 March 2025 |
59.34 (14.25%) |
50.10 |
50.10 - 61.72 |
1.9771 times |
Fri 28 February 2025 |
51.94 (-11.23%) |
56.04 |
51.15 - 60.48 |
1.6891 times |
Fri 31 January 2025 |
58.51 (-3.72%) |
60.31 |
55.56 - 63.63 |
1.6276 times |
Tue 31 December 2024 |
60.77 (-25.14%) |
81.50 |
60.55 - 84.59 |
4.1286 times |

DMA SMA EMA moving averages of Sanghi Ind 526521
DMA (daily moving average) of Sanghi Ind 526521
| DMA period | DMA value | | 5 day DMA | 64.55 | | 12 day DMA | 64.28 | | 20 day DMA | 64.45 | | 35 day DMA | 64.56 | | 50 day DMA | 64.68 | | 100 day DMA | 64.65 | | 150 day DMA | 63.08 | | 200 day DMA | 61.81 | EMA (exponential moving average) of Sanghi Ind 526521
| EMA period | EMA current | EMA prev | EMA prev2 | | 5 day EMA | 64.48 | 64.48 | 64.36 | | 12 day EMA | 64.45 | 64.44 | 64.39 | | 20 day EMA | 64.52 | 64.52 | 64.5 | | 35 day EMA | 64.62 | 64.63 | 64.62 | | 50 day EMA | 64.83 | 64.84 | 64.85 |
SMA (simple moving average) of Sanghi Ind 526521
| SMA period | SMA current | SMA prev | SMA prev2 | | 5 day SMA | 64.55 | 64.45 | 64.3 | | 12 day SMA | 64.28 | 64.3 | 64.34 | | 20 day SMA | 64.45 | 64.56 | 64.69 | | 35 day SMA | 64.56 | 64.54 | 64.5 | | 50 day SMA | 64.68 | 64.69 | 64.73 | | 100 day SMA | 64.65 | 64.63 | 64.6 | | 150 day SMA | 63.08 | 63.02 | 62.95 | | 200 day SMA | 61.81 | 61.79 | 61.78 |
|
|
