CindrellaHt 526373 full analysis,charts,indicators,moving averages,SMA,DMA,EMA,ADX,MACD,RSICindrella Ht 526373 WideScreen charts, DMA,SMA,EMA technical analysis, forecast prediction, by indicators ADX,MACD,RSI,CCI BSE stock exchange
Daily price and charts and targets CindrellaHt Strong Daily Stock price targets for CindrellaHt 526373 are 61.95 and 62.05 | Daily Target 1 | 61.87 | | Daily Target 2 | 61.93 | | Daily Target 3 | 61.966666666667 | | Daily Target 4 | 62.03 | | Daily Target 5 | 62.07 |
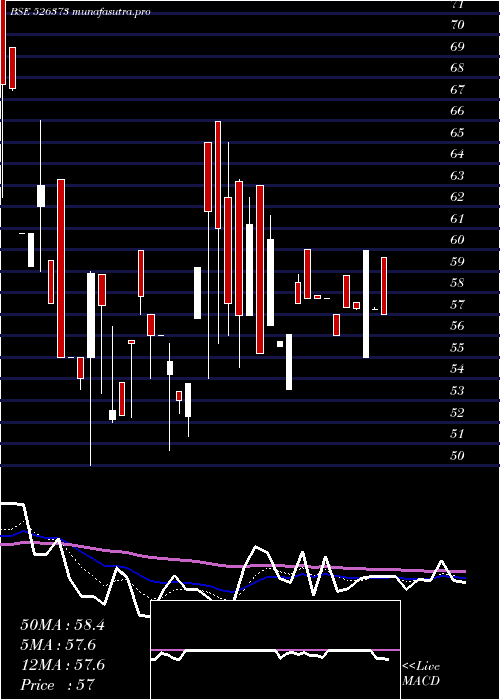
Daily price and volume Cindrella Ht
| Date |
Closing |
Open |
Range |
Volume |
Mon 20 October 2025 |
62.00 (2.56%) |
61.90 |
61.90 - 62.00 |
0.3175 times |
Thu 16 October 2025 |
60.45 (0%) |
60.50 |
60.45 - 60.50 |
0.127 times |
Wed 15 October 2025 |
60.45 (0.17%) |
60.45 |
60.45 - 62.00 |
0.271 times |
Tue 14 October 2025 |
60.35 (-3.75%) |
60.45 |
60.35 - 60.45 |
0.4234 times |
Mon 13 October 2025 |
62.70 (-5%) |
62.76 |
62.70 - 62.76 |
0.597 times |
Thu 09 October 2025 |
66.00 (-1.45%) |
66.97 |
66.00 - 66.97 |
1.503 times |
Wed 08 October 2025 |
66.97 (3.32%) |
62.55 |
62.20 - 66.97 |
1.486 times |
Tue 07 October 2025 |
64.82 (-5%) |
64.82 |
64.82 - 64.82 |
0.961 times |
Mon 06 October 2025 |
68.23 (4.99%) |
64.97 |
64.97 - 68.23 |
0.0762 times |
Fri 03 October 2025 |
64.99 (0.26%) |
64.80 |
62.81 - 67.75 |
4.2379 times |
Wed 01 October 2025 |
64.82 (0%) |
64.80 |
64.80 - 64.82 |
0.4572 times |
Weekly price and charts CindrellaHt Strong weekly Stock price targets for CindrellaHt 526373 are 61.95 and 62.05 | Weekly Target 1 | 61.87 | | Weekly Target 2 | 61.93 | | Weekly Target 3 | 61.966666666667 | | Weekly Target 4 | 62.03 | | Weekly Target 5 | 62.07 |
Weekly price and volumes for Cindrella Ht
| Date |
Closing |
Open |
Range |
Volume |
Mon 20 October 2025 |
62.00 (2.56%) |
61.90 |
61.90 - 62.00 |
0.0606 times |
Thu 16 October 2025 |
60.45 (-8.41%) |
62.76 |
60.35 - 62.76 |
0.2705 times |
Thu 09 October 2025 |
66.00 (1.55%) |
64.97 |
62.20 - 68.23 |
0.7678 times |
Fri 03 October 2025 |
64.99 (0.22%) |
64.85 |
62.53 - 67.75 |
1.0762 times |
Fri 26 September 2025 |
64.85 (2.94%) |
64.26 |
62.35 - 64.85 |
0.9365 times |
Fri 19 September 2025 |
63.00 (-2.85%) |
68.09 |
62.56 - 68.09 |
3.1011 times |
Fri 12 September 2025 |
64.85 (-4.63%) |
71.40 |
64.85 - 71.40 |
0.7363 times |
Wed 03 September 2025 |
68.00 (-2.62%) |
69.13 |
68.00 - 73.50 |
2.6441 times |
Tue 26 August 2025 |
69.83 (0%) |
69.83 |
69.83 - 69.83 |
0.0234 times |
Fri 22 August 2025 |
69.83 (1.2%) |
72.45 |
66.50 - 72.45 |
0.3835 times |
Thu 14 August 2025 |
69.00 (-3.4%) |
68.02 |
68.02 - 71.42 |
1.6196 times |
Monthly price and charts CindrellaHt Strong monthly Stock price targets for CindrellaHt 526373 are 57.24 and 65.12 | Monthly Target 1 | 55.65 | | Monthly Target 2 | 58.82 | | Monthly Target 3 | 63.526666666667 | | Monthly Target 4 | 66.7 | | Monthly Target 5 | 71.41 |
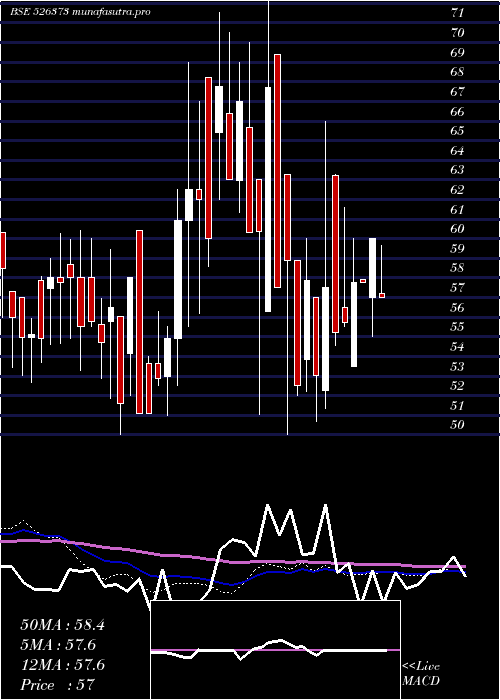
Monthly price and volumes Cindrella Ht
| Date |
Closing |
Open |
Range |
Volume |
Mon 20 October 2025 |
62.00 (-4.35%) |
64.80 |
60.35 - 68.23 |
0.1493 times |
Tue 30 September 2025 |
64.82 (-7.17%) |
69.13 |
62.35 - 73.50 |
0.5688 times |
Tue 26 August 2025 |
69.83 (-1.99%) |
69.70 |
66.50 - 72.45 |
0.1881 times |
Wed 30 July 2025 |
71.25 (-1.51%) |
75.00 |
68.40 - 81.58 |
0.7266 times |
Mon 30 June 2025 |
72.34 (24.79%) |
57.97 |
57.02 - 76.48 |
5.4002 times |
Fri 30 May 2025 |
57.97 (1.7%) |
59.64 |
56.12 - 62.90 |
0.6497 times |
Wed 30 April 2025 |
57.00 (3.26%) |
56.50 |
53.51 - 61.60 |
0.215 times |
Wed 26 March 2025 |
55.20 (5.1%) |
53.84 |
50.67 - 65.98 |
0.4692 times |
Fri 28 February 2025 |
52.52 (-12.99%) |
56.31 |
50.00 - 73.70 |
0.6031 times |
Fri 31 January 2025 |
60.36 (-7.44%) |
62.00 |
51.02 - 70.50 |
1.0299 times |
Tue 31 December 2024 |
65.21 (18.78%) |
54.90 |
52.50 - 71.50 |
3.7655 times |

DMA SMA EMA moving averages of Cindrella Ht 526373
DMA (daily moving average) of Cindrella Ht 526373
| DMA period | DMA value | | 5 day DMA | 61.19 | | 12 day DMA | 63.88 | | 20 day DMA | 63.95 | | 35 day DMA | 65.81 | | 50 day DMA | 67.59 | | 100 day DMA | 67.1 | | 150 day DMA | 64.24 | | 200 day DMA | 63.36 | EMA (exponential moving average) of Cindrella Ht 526373
| EMA period | EMA current | EMA prev | EMA prev2 | | 5 day EMA | 61.84 | 61.76 | 62.42 | | 12 day EMA | 63.13 | 63.34 | 63.87 | | 20 day EMA | 64.14 | 64.37 | 64.78 | | 35 day EMA | 65.89 | 66.12 | 66.45 | | 50 day EMA | 67.49 | 67.71 | 68.01 |
SMA (simple moving average) of Cindrella Ht 526373
| SMA period | SMA current | SMA prev | SMA prev2 | | 5 day SMA | 61.19 | 61.99 | 63.29 | | 12 day SMA | 63.88 | 64.12 | 64.49 | | 20 day SMA | 63.95 | 64.14 | 64.42 | | 35 day SMA | 65.81 | 66.01 | 66.25 | | 50 day SMA | 67.59 | 67.9 | 68.17 | | 100 day SMA | 67.1 | 67.05 | 67.02 | | 150 day SMA | 64.24 | 64.29 | 64.33 | | 200 day SMA | 63.36 | 63.33 | 63.32 |
|
|
