StdSurfact 526231 full analysis,charts,indicators,moving averages,SMA,DMA,EMA,ADX,MACD,RSIStd Surfact 526231 WideScreen charts, DMA,SMA,EMA technical analysis, forecast prediction, by indicators ADX,MACD,RSI,CCI BSE stock exchange
Daily price and charts and targets StdSurfact Strong Daily Stock price targets for StdSurfact 526231 are 53.5 and 54.5 | Daily Target 1 | 52.67 | | Daily Target 2 | 53.33 | | Daily Target 3 | 53.666666666667 | | Daily Target 4 | 54.33 | | Daily Target 5 | 54.67 |
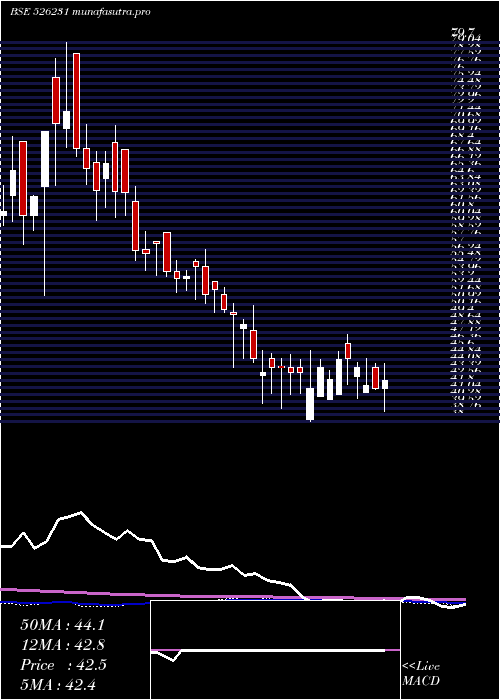
Daily price and volume Std Surfact
| Date |
Closing |
Open |
Range |
Volume |
Tue 21 October 2025 |
54.00 (1.89%) |
53.00 |
53.00 - 54.00 |
0.7024 times |
Mon 20 October 2025 |
53.00 (1.94%) |
53.29 |
53.00 - 53.29 |
0.1071 times |
Fri 17 October 2025 |
51.99 (-1.91%) |
50.03 |
50.03 - 54.88 |
1.066 times |
Thu 16 October 2025 |
53.00 (-0.67%) |
49.50 |
49.50 - 55.20 |
0.5978 times |
Wed 15 October 2025 |
53.36 (3.13%) |
51.74 |
49.11 - 53.43 |
2.7148 times |
Tue 14 October 2025 |
51.74 (-0.48%) |
51.74 |
50.59 - 51.74 |
0.122 times |
Mon 13 October 2025 |
51.99 (-3.94%) |
54.12 |
50.51 - 56.00 |
2.4359 times |
Fri 10 October 2025 |
54.12 (1.88%) |
55.04 |
54.00 - 55.04 |
0.5056 times |
Thu 09 October 2025 |
53.12 (-1.61%) |
52.00 |
50.05 - 55.59 |
1.0461 times |
Wed 08 October 2025 |
53.99 (-0.88%) |
51.00 |
50.40 - 53.99 |
0.7024 times |
Mon 06 October 2025 |
54.47 (4.07%) |
52.34 |
52.34 - 54.75 |
0.0473 times |

Weekly price and charts StdSurfact Strong weekly Stock price targets for StdSurfact 526231 are 53.5 and 54.5 | Weekly Target 1 | 52.67 | | Weekly Target 2 | 53.33 | | Weekly Target 3 | 53.666666666667 | | Weekly Target 4 | 54.33 | | Weekly Target 5 | 54.67 |
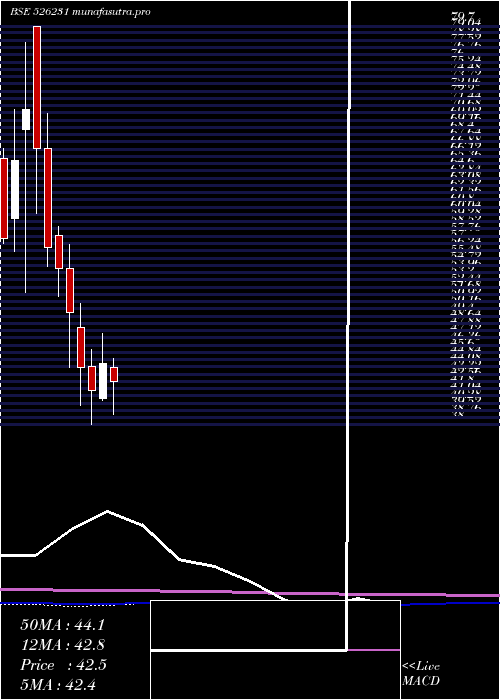
Weekly price and volumes for Std Surfact
| Date |
Closing |
Open |
Range |
Volume |
Tue 21 October 2025 |
54.00 (3.87%) |
53.29 |
53.00 - 54.00 |
0.0866 times |
Fri 17 October 2025 |
51.99 (-3.94%) |
54.12 |
49.11 - 56.00 |
0.7419 times |
Fri 10 October 2025 |
54.12 (3.4%) |
52.34 |
50.05 - 55.59 |
0.2461 times |
Fri 03 October 2025 |
52.34 (-2.97%) |
57.49 |
51.11 - 58.90 |
1.0676 times |
Fri 26 September 2025 |
53.94 (-6.08%) |
54.43 |
52.35 - 57.08 |
1.3963 times |
Fri 19 September 2025 |
57.43 (-4.32%) |
60.02 |
54.58 - 60.02 |
0.9957 times |
Fri 12 September 2025 |
60.02 (-3.02%) |
63.00 |
57.61 - 64.49 |
0.8431 times |
Fri 05 September 2025 |
61.89 (-2.44%) |
59.40 |
56.29 - 63.79 |
2.0181 times |
Fri 29 August 2025 |
63.44 (7.89%) |
56.70 |
56.66 - 69.00 |
1.045 times |
Fri 22 August 2025 |
58.80 (-2.79%) |
60.29 |
54.21 - 60.30 |
1.5596 times |
Thu 14 August 2025 |
60.49 (0.82%) |
61.90 |
56.58 - 67.99 |
1.3625 times |
Monthly price and charts StdSurfact Strong monthly Stock price targets for StdSurfact 526231 are 51.56 and 61.35 | Monthly Target 1 | 44.21 | | Monthly Target 2 | 49.11 | | Monthly Target 3 | 54.003333333333 | | Monthly Target 4 | 58.9 | | Monthly Target 5 | 63.79 |
Monthly price and volumes Std Surfact
| Date |
Closing |
Open |
Range |
Volume |
Tue 21 October 2025 |
54.00 (-3.24%) |
52.34 |
49.11 - 58.90 |
0.1906 times |
Tue 30 September 2025 |
55.81 (-12.03%) |
59.40 |
52.35 - 64.49 |
0.5639 times |
Fri 29 August 2025 |
63.44 (-3.86%) |
62.56 |
54.21 - 69.00 |
0.6551 times |
Thu 31 July 2025 |
65.99 (23.53%) |
53.50 |
53.21 - 67.89 |
2.6911 times |
Mon 30 June 2025 |
53.42 (1.62%) |
52.57 |
45.11 - 55.25 |
1.3023 times |
Fri 30 May 2025 |
52.57 (18.43%) |
44.05 |
39.10 - 54.68 |
1.0292 times |
Wed 30 April 2025 |
44.39 (6.66%) |
40.79 |
40.51 - 47.60 |
0.348 times |
Fri 28 March 2025 |
41.62 (-5.41%) |
44.10 |
38.00 - 45.87 |
1.6858 times |
Fri 28 February 2025 |
44.00 (-11.68%) |
48.25 |
40.00 - 50.76 |
0.6179 times |
Fri 31 January 2025 |
49.82 (-8.39%) |
54.38 |
44.00 - 56.92 |
0.916 times |
Tue 31 December 2024 |
54.38 (-3.82%) |
57.80 |
51.41 - 58.80 |
1.3194 times |
DMA SMA EMA moving averages of Std Surfact 526231
DMA (daily moving average) of Std Surfact 526231
| DMA period | DMA value | | 5 day DMA | 53.07 | | 12 day DMA | 53.09 | | 20 day DMA | 54.05 | | 35 day DMA | 57.04 | | 50 day DMA | 58.03 | | 100 day DMA | 56.91 | | 150 day DMA | 52.32 | | 200 day DMA | 51.82 | EMA (exponential moving average) of Std Surfact 526231
| EMA period | EMA current | EMA prev | EMA prev2 | | 5 day EMA | 53.18 | 52.77 | 52.66 | | 12 day EMA | 53.55 | 53.47 | 53.56 | | 20 day EMA | 54.48 | 54.53 | 54.69 | | 35 day EMA | 56.09 | 56.21 | 56.4 | | 50 day EMA | 58.02 | 58.18 | 58.39 |
SMA (simple moving average) of Std Surfact 526231
| SMA period | SMA current | SMA prev | SMA prev2 | | 5 day SMA | 53.07 | 52.62 | 52.42 | | 12 day SMA | 53.09 | 53.4 | 53.63 | | 20 day SMA | 54.05 | 54.22 | 54.51 | | 35 day SMA | 57.04 | 57.32 | 57.53 | | 50 day SMA | 58.03 | 58.13 | 58.35 | | 100 day SMA | 56.91 | 56.8 | 56.67 | | 150 day SMA | 52.32 | 52.25 | 52.19 | | 200 day SMA | 51.82 | 51.82 | 51.83 |
|
|
