GalaxyBear 526073 full analysis,charts,indicators,moving averages,SMA,DMA,EMA,ADX,MACD,RSIGalaxy Bear 526073 WideScreen charts, DMA,SMA,EMA technical analysis, forecast prediction, by indicators ADX,MACD,RSI,CCI BSE stock exchange
Daily price and charts and targets GalaxyBear Strong Daily Stock price targets for GalaxyBear 526073 are 683.15 and 709.15 | Daily Target 1 | 662.77 | | Daily Target 2 | 677.53 | | Daily Target 3 | 688.76666666667 | | Daily Target 4 | 703.53 | | Daily Target 5 | 714.77 |
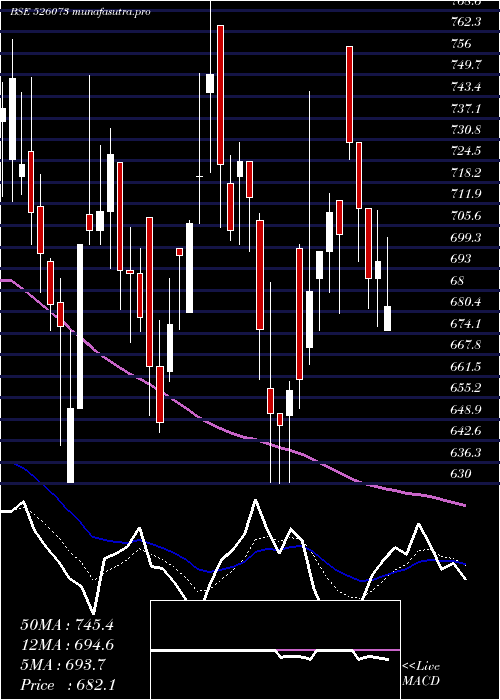
Daily price and volume Galaxy Bear
| Date |
Closing |
Open |
Range |
Volume |
Fri 05 December 2025 |
692.30 (2.59%) |
674.00 |
674.00 - 700.00 |
0.8289 times |
Thu 04 December 2025 |
674.80 (-1.03%) |
682.10 |
666.60 - 682.10 |
0.9719 times |
Wed 03 December 2025 |
681.80 (-1.2%) |
690.10 |
680.00 - 690.10 |
1.3904 times |
Tue 02 December 2025 |
690.10 (-4.81%) |
722.10 |
682.60 - 722.10 |
1.875 times |
Mon 01 December 2025 |
725.00 (-1.09%) |
722.10 |
722.10 - 738.80 |
0.3443 times |
Fri 28 November 2025 |
733.00 (0.95%) |
733.40 |
724.00 - 735.00 |
0.0583 times |
Thu 27 November 2025 |
726.10 (-2.02%) |
755.50 |
724.80 - 755.50 |
1.0408 times |
Wed 26 November 2025 |
741.10 (2.14%) |
740.15 |
726.10 - 748.80 |
1.5757 times |
Tue 25 November 2025 |
725.60 (-0.85%) |
716.00 |
716.00 - 754.00 |
0.9666 times |
Mon 24 November 2025 |
731.85 (-1.29%) |
767.95 |
725.50 - 767.95 |
0.9481 times |
Fri 21 November 2025 |
741.45 (-1.78%) |
737.00 |
735.00 - 758.85 |
1.8459 times |
Weekly price and charts GalaxyBear Strong weekly Stock price targets for GalaxyBear 526073 are 643.35 and 715.55 | Weekly Target 1 | 627.03 | | Weekly Target 2 | 659.67 | | Weekly Target 3 | 699.23333333333 | | Weekly Target 4 | 731.87 | | Weekly Target 5 | 771.43 |
Weekly price and volumes for Galaxy Bear
| Date |
Closing |
Open |
Range |
Volume |
Fri 05 December 2025 |
692.30 (-5.55%) |
722.10 |
666.60 - 738.80 |
0.5958 times |
Fri 28 November 2025 |
733.00 (-1.14%) |
767.95 |
716.00 - 767.95 |
0.5054 times |
Fri 21 November 2025 |
741.45 (-3.29%) |
750.05 |
722.25 - 774.50 |
0.8968 times |
Fri 14 November 2025 |
766.70 (0.67%) |
764.95 |
737.25 - 801.00 |
1.1007 times |
Fri 07 November 2025 |
761.60 (1.34%) |
789.90 |
740.00 - 789.90 |
0.8286 times |
Fri 31 October 2025 |
751.50 (-8.72%) |
799.90 |
737.00 - 813.90 |
2.6391 times |
Thu 23 October 2025 |
823.30 (8.56%) |
759.00 |
750.00 - 887.00 |
0.8204 times |
Fri 17 October 2025 |
758.35 (-11.38%) |
854.85 |
756.00 - 854.85 |
1.1619 times |
Fri 10 October 2025 |
855.70 (-1.95%) |
884.00 |
835.00 - 884.75 |
0.4719 times |
Fri 03 October 2025 |
872.75 (0.55%) |
875.00 |
860.00 - 914.00 |
0.9794 times |
Fri 26 September 2025 |
868.00 (-4.38%) |
918.90 |
860.00 - 918.90 |
0.9936 times |

Monthly price and charts GalaxyBear Strong monthly Stock price targets for GalaxyBear 526073 are 643.35 and 715.55 | Monthly Target 1 | 627.03 | | Monthly Target 2 | 659.67 | | Monthly Target 3 | 699.23333333333 | | Monthly Target 4 | 731.87 | | Monthly Target 5 | 771.43 |
Monthly price and volumes Galaxy Bear
| Date |
Closing |
Open |
Range |
Volume |
Fri 05 December 2025 |
692.30 (-5.55%) |
722.10 |
666.60 - 738.80 |
0.1072 times |
Fri 28 November 2025 |
733.00 (-2.46%) |
789.90 |
716.00 - 801.00 |
0.5992 times |
Fri 31 October 2025 |
751.50 (-14.51%) |
879.00 |
737.00 - 905.00 |
1.0092 times |
Tue 30 September 2025 |
879.05 (-0.39%) |
883.20 |
849.80 - 928.70 |
0.6029 times |
Fri 29 August 2025 |
882.45 (-3.95%) |
902.25 |
853.35 - 1000.00 |
1.2444 times |
Thu 31 July 2025 |
918.70 (1.48%) |
895.20 |
856.30 - 974.00 |
0.6277 times |
Mon 30 June 2025 |
905.30 (-5.66%) |
959.60 |
896.00 - 988.00 |
0.8956 times |
Fri 30 May 2025 |
959.60 (40.69%) |
721.80 |
623.30 - 1100.00 |
2.6948 times |
Wed 30 April 2025 |
682.05 (-3.15%) |
719.90 |
630.00 - 758.00 |
0.889 times |
Fri 28 March 2025 |
704.20 (3.19%) |
683.00 |
630.25 - 779.00 |
1.3301 times |
Fri 28 February 2025 |
682.45 (-30.34%) |
810.00 |
661.05 - 911.05 |
1.2858 times |

DMA SMA EMA moving averages of Galaxy Bear 526073
DMA (daily moving average) of Galaxy Bear 526073
| DMA period | DMA value | | 5 day DMA | 692.8 | | 12 day DMA | 718.17 | | 20 day DMA | 733.21 | | 35 day DMA | 753.88 | | 50 day DMA | 788.76 | | 100 day DMA | 849.15 | | 150 day DMA | 863.82 | | 200 day DMA | 827.84 | EMA (exponential moving average) of Galaxy Bear 526073
| EMA period | EMA current | EMA prev | EMA prev2 | | 5 day EMA | 694.31 | 695.32 | 705.58 | | 12 day EMA | 713.22 | 717.02 | 724.69 | | 20 day EMA | 729.74 | 733.68 | 739.88 | | 35 day EMA | 760.4 | 764.41 | 769.69 | | 50 day EMA | 787.9 | 791.8 | 796.57 |
SMA (simple moving average) of Galaxy Bear 526073
| SMA period | SMA current | SMA prev | SMA prev2 | | 5 day SMA | 692.8 | 700.94 | 711.2 | | 12 day SMA | 718.17 | 724.11 | 729.29 | | 20 day SMA | 733.21 | 736.42 | 740.73 | | 35 day SMA | 753.88 | 758.03 | 763.2 | | 50 day SMA | 788.76 | 793.07 | 797.4 | | 100 day SMA | 849.15 | 851.38 | 853.78 | | 150 day SMA | 863.82 | 863.8 | 864.04 | | 200 day SMA | 827.84 | 828.53 | 830.06 |
|
|
