NatcoPharm 524816 full analysis,charts,indicators,moving averages,SMA,DMA,EMA,ADX,MACD,RSINatco Pharm 524816 WideScreen charts, DMA,SMA,EMA technical analysis, forecast prediction, by indicators ADX,MACD,RSI,CCI BSE stock exchange
Daily price and charts and targets NatcoPharm Strong Daily Stock price targets for NatcoPharm 524816 are 839.03 and 847.73 | Daily Target 1 | 832.22 | | Daily Target 2 | 837.13 | | Daily Target 3 | 840.91666666667 | | Daily Target 4 | 845.83 | | Daily Target 5 | 849.62 |
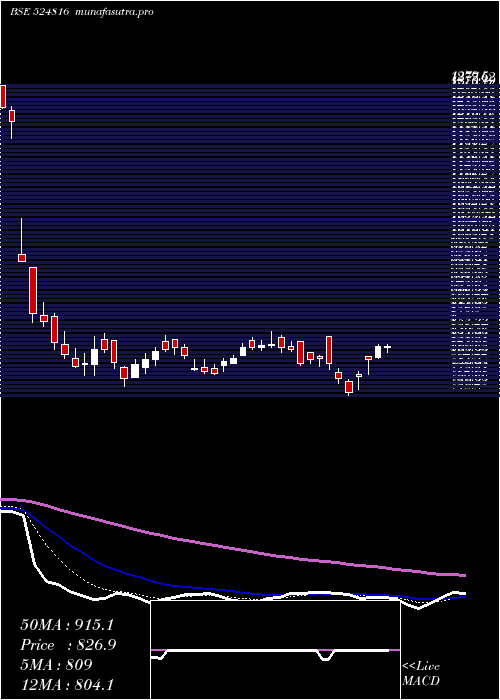
Daily price and volume Natco Pharm
| Date |
Closing |
Open |
Range |
Volume |
Tue 21 October 2025 |
842.05 (1.01%) |
840.00 |
836.00 - 844.70 |
0.1486 times |
Mon 20 October 2025 |
833.60 (0.9%) |
830.80 |
826.85 - 836.75 |
0.5316 times |
Fri 17 October 2025 |
826.20 (0.54%) |
828.95 |
815.70 - 847.25 |
0.8247 times |
Thu 16 October 2025 |
821.75 (0.16%) |
820.65 |
818.05 - 825.00 |
0.5552 times |
Wed 15 October 2025 |
820.45 (1.32%) |
812.35 |
808.85 - 822.00 |
0.7919 times |
Tue 14 October 2025 |
809.75 (-3.63%) |
845.15 |
804.95 - 845.15 |
1.4894 times |
Mon 13 October 2025 |
840.25 (-0.51%) |
851.90 |
836.80 - 851.90 |
0.4205 times |
Fri 10 October 2025 |
844.55 (3.81%) |
841.05 |
834.20 - 862.65 |
4.8821 times |
Thu 09 October 2025 |
813.55 (0.66%) |
810.95 |
810.65 - 821.30 |
0.1922 times |
Wed 08 October 2025 |
808.25 (-0.36%) |
811.15 |
806.80 - 819.00 |
0.1638 times |
Tue 07 October 2025 |
811.15 (-0.53%) |
818.35 |
809.00 - 821.90 |
0.4595 times |
Weekly price and charts NatcoPharm Strong weekly Stock price targets for NatcoPharm 524816 are 834.45 and 852.3 | Weekly Target 1 | 820.02 | | Weekly Target 2 | 831.03 | | Weekly Target 3 | 837.86666666667 | | Weekly Target 4 | 848.88 | | Weekly Target 5 | 855.72 |
Weekly price and volumes for Natco Pharm
| Date |
Closing |
Open |
Range |
Volume |
Tue 21 October 2025 |
842.05 (1.92%) |
830.80 |
826.85 - 844.70 |
0.1726 times |
Fri 17 October 2025 |
826.20 (-2.17%) |
851.90 |
804.95 - 851.90 |
1.0356 times |
Fri 10 October 2025 |
844.55 (2.61%) |
828.50 |
806.80 - 862.65 |
1.6748 times |
Fri 03 October 2025 |
823.10 (0.28%) |
820.80 |
789.30 - 825.45 |
0.8614 times |
Fri 26 September 2025 |
820.80 (-7.25%) |
884.95 |
797.00 - 884.95 |
1.6614 times |
Fri 19 September 2025 |
884.95 (2.63%) |
865.05 |
849.00 - 896.70 |
1.3909 times |
Fri 12 September 2025 |
862.30 (1.07%) |
853.25 |
841.00 - 863.90 |
0.9338 times |
Fri 05 September 2025 |
853.15 (-0.98%) |
860.85 |
850.50 - 883.95 |
0.7983 times |
Fri 29 August 2025 |
861.60 (-2.39%) |
887.65 |
848.45 - 892.60 |
0.7424 times |
Fri 22 August 2025 |
882.70 (0.85%) |
876.30 |
872.00 - 898.40 |
0.7287 times |
Thu 14 August 2025 |
875.25 (-3.66%) |
913.30 |
871.30 - 923.50 |
0.9303 times |

Monthly price and charts NatcoPharm Strong monthly Stock price targets for NatcoPharm 524816 are 820.03 and 884.68 | Monthly Target 1 | 769.58 | | Monthly Target 2 | 805.82 | | Monthly Target 3 | 834.23333333333 | | Monthly Target 4 | 870.47 | | Monthly Target 5 | 898.88 |
Monthly price and volumes Natco Pharm
| Date |
Closing |
Open |
Range |
Volume |
Tue 21 October 2025 |
842.05 (5.85%) |
799.00 |
798.00 - 862.65 |
0.5589 times |
Tue 30 September 2025 |
795.55 (-7.67%) |
860.85 |
789.30 - 896.70 |
0.8879 times |
Fri 29 August 2025 |
861.60 (-9.66%) |
953.40 |
848.45 - 953.45 |
0.6461 times |
Thu 31 July 2025 |
953.70 (2.85%) |
941.10 |
916.60 - 1059.60 |
1.7627 times |
Mon 30 June 2025 |
927.30 (4.96%) |
883.10 |
853.20 - 955.00 |
0.9565 times |
Fri 30 May 2025 |
883.45 (3.82%) |
847.15 |
752.10 - 919.90 |
0.905 times |
Wed 30 April 2025 |
850.95 (6.68%) |
816.10 |
742.80 - 970.00 |
1.4821 times |
Fri 28 March 2025 |
797.70 (3.38%) |
772.90 |
772.90 - 852.55 |
0.79 times |
Fri 28 February 2025 |
771.65 (-34.37%) |
1175.10 |
757.75 - 1340.45 |
1.2991 times |
Fri 31 January 2025 |
1175.75 (-15.25%) |
1390.00 |
1110.00 - 1419.50 |
0.7116 times |
Tue 31 December 2024 |
1387.30 (0.86%) |
1375.55 |
1357.00 - 1504.00 |
0.6655 times |

DMA SMA EMA moving averages of Natco Pharm 524816
DMA (daily moving average) of Natco Pharm 524816
| DMA period | DMA value | | 5 day DMA | 828.81 | | 12 day DMA | 823.92 | | 20 day DMA | 824.22 | | 35 day DMA | 839.2 | | 50 day DMA | 851.84 | | 100 day DMA | 893.94 | | 150 day DMA | 872.53 | | 200 day DMA | 942.08 | EMA (exponential moving average) of Natco Pharm 524816
| EMA period | EMA current | EMA prev | EMA prev2 | | 5 day EMA | 831.84 | 826.73 | 823.3 | | 12 day EMA | 828.14 | 825.61 | 824.16 | | 20 day EMA | 831.12 | 829.97 | 829.59 | | 35 day EMA | 841.85 | 841.84 | 842.33 | | 50 day EMA | 856.16 | 856.74 | 857.68 |
SMA (simple moving average) of Natco Pharm 524816
| SMA period | SMA current | SMA prev | SMA prev2 | | 5 day SMA | 828.81 | 822.35 | 823.68 | | 12 day SMA | 823.92 | 822.34 | 820.14 | | 20 day SMA | 824.22 | 825.35 | 827.92 | | 35 day SMA | 839.2 | 839.85 | 840.65 | | 50 day SMA | 851.84 | 853.91 | 855.59 | | 100 day SMA | 893.94 | 894.14 | 894.59 | | 150 day SMA | 872.53 | 872.37 | 872.18 | | 200 day SMA | 942.08 | 944.82 | 947.75 |
|
|
