SunPharma 524715 full analysis,charts,indicators,moving averages,SMA,DMA,EMA,ADX,MACD,RSISun Pharma 524715 WideScreen charts, DMA,SMA,EMA technical analysis, forecast prediction, by indicators ADX,MACD,RSI,CCI BSE stock exchange
Daily price and charts and targets SunPharma Strong Daily Stock price targets for SunPharma 524715 are 1687.65 and 1699.9 | Daily Target 1 | 1678.6 | | Daily Target 2 | 1684.45 | | Daily Target 3 | 1690.85 | | Daily Target 4 | 1696.7 | | Daily Target 5 | 1703.1 |
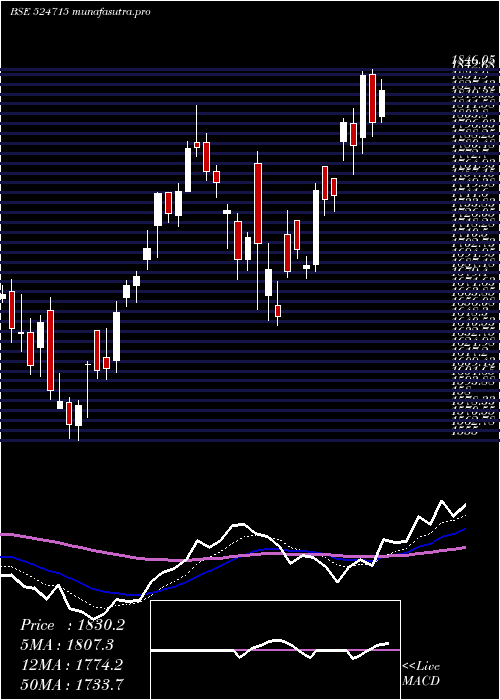
Daily price and volume Sun Pharma
| Date |
Closing |
Open |
Range |
Volume |
Tue 21 October 2025 |
1690.30 (0.1%) |
1688.55 |
1685.00 - 1697.25 |
0.1184 times |
Mon 20 October 2025 |
1688.55 (0.56%) |
1681.20 |
1681.20 - 1696.40 |
0.7134 times |
Fri 17 October 2025 |
1679.10 (1.17%) |
1659.70 |
1656.10 - 1691.65 |
1.2948 times |
Thu 16 October 2025 |
1659.70 (0.34%) |
1662.20 |
1643.10 - 1662.20 |
1.6204 times |
Wed 15 October 2025 |
1654.05 (0%) |
1648.40 |
1648.40 - 1668.20 |
0.3908 times |
Tue 14 October 2025 |
1654.05 (-0.87%) |
1668.40 |
1647.00 - 1668.40 |
0.7662 times |
Mon 13 October 2025 |
1668.50 (-0.14%) |
1660.40 |
1656.00 - 1672.50 |
1.757 times |
Fri 10 October 2025 |
1670.85 (0.75%) |
1657.40 |
1650.00 - 1676.00 |
1.2085 times |
Thu 09 October 2025 |
1658.35 (1.64%) |
1636.00 |
1633.00 - 1662.00 |
1.1266 times |
Wed 08 October 2025 |
1631.65 (-1.37%) |
1645.00 |
1628.75 - 1654.30 |
1.0038 times |
Tue 07 October 2025 |
1654.30 (0.02%) |
1653.85 |
1647.75 - 1662.40 |
1.4509 times |
Weekly price and charts SunPharma Strong weekly Stock price targets for SunPharma 524715 are 1685.75 and 1701.8 | Weekly Target 1 | 1673.53 | | Weekly Target 2 | 1681.92 | | Weekly Target 3 | 1689.5833333333 | | Weekly Target 4 | 1697.97 | | Weekly Target 5 | 1705.63 |
Weekly price and volumes for Sun Pharma
| Date |
Closing |
Open |
Range |
Volume |
Tue 21 October 2025 |
1690.30 (0.67%) |
1681.20 |
1681.20 - 1697.25 |
0.0903 times |
Fri 17 October 2025 |
1679.10 (0.49%) |
1660.40 |
1643.10 - 1691.65 |
0.6326 times |
Fri 10 October 2025 |
1670.85 (2.25%) |
1621.95 |
1620.10 - 1676.00 |
0.5888 times |
Fri 03 October 2025 |
1634.05 (2.99%) |
1556.25 |
1556.25 - 1651.95 |
0.9999 times |
Fri 26 September 2025 |
1586.55 (-4.2%) |
1646.05 |
1547.25 - 1656.80 |
1.6273 times |
Fri 19 September 2025 |
1656.05 (2.46%) |
1619.45 |
1595.20 - 1668.40 |
1.4723 times |
Fri 12 September 2025 |
1616.25 (1.35%) |
1595.15 |
1577.90 - 1621.00 |
1.3846 times |
Fri 05 September 2025 |
1594.70 (0.04%) |
1600.00 |
1556.25 - 1600.35 |
1.0421 times |
Fri 29 August 2025 |
1594.05 (-2.97%) |
1643.50 |
1567.60 - 1659.80 |
1.5269 times |
Fri 22 August 2025 |
1642.90 (0.02%) |
1643.20 |
1616.60 - 1652.00 |
0.6352 times |
Thu 14 August 2025 |
1642.60 (3.52%) |
1586.70 |
1584.50 - 1652.30 |
0.3356 times |

Monthly price and charts SunPharma Strong monthly Stock price targets for SunPharma 524715 are 1647.05 and 1740.5 | Monthly Target 1 | 1570.33 | | Monthly Target 2 | 1630.32 | | Monthly Target 3 | 1663.7833333333 | | Monthly Target 4 | 1723.77 | | Monthly Target 5 | 1757.23 |
Monthly price and volumes Sun Pharma
| Date |
Closing |
Open |
Range |
Volume |
Tue 21 October 2025 |
1690.30 (5.98%) |
1606.35 |
1603.80 - 1697.25 |
0.553 times |
Tue 30 September 2025 |
1594.95 (0.06%) |
1600.00 |
1547.25 - 1668.40 |
1.7594 times |
Fri 29 August 2025 |
1594.05 (-6.54%) |
1690.10 |
1567.60 - 1690.40 |
1.1735 times |
Thu 31 July 2025 |
1705.55 (1.71%) |
1678.60 |
1646.95 - 1747.70 |
1.2127 times |
Mon 30 June 2025 |
1676.80 (-0.09%) |
1684.75 |
1636.00 - 1727.50 |
1.3463 times |
Fri 30 May 2025 |
1678.30 (-8.3%) |
1832.05 |
1623.50 - 1850.95 |
1.3737 times |
Wed 30 April 2025 |
1830.20 (5.46%) |
1727.15 |
1645.00 - 1846.05 |
0.5981 times |
Fri 28 March 2025 |
1735.45 (8.88%) |
1580.20 |
1555.00 - 1818.35 |
0.8421 times |
Fri 28 February 2025 |
1593.90 (-8.56%) |
1775.00 |
1587.40 - 1787.65 |
0.4895 times |
Fri 31 January 2025 |
1743.10 (-7.5%) |
1886.45 |
1693.65 - 1902.60 |
0.6516 times |
Tue 31 December 2024 |
1884.50 (5.77%) |
1800.15 |
1774.20 - 1910.00 |
0.6961 times |

DMA SMA EMA moving averages of Sun Pharma 524715
DMA (daily moving average) of Sun Pharma 524715
| DMA period | DMA value | | 5 day DMA | 1674.34 | | 12 day DMA | 1663.61 | | 20 day DMA | 1644.6 | | 35 day DMA | 1628.3 | | 50 day DMA | 1625.41 | | 100 day DMA | 1650.82 | | 150 day DMA | 1676.66 | | 200 day DMA | 1695.24 | EMA (exponential moving average) of Sun Pharma 524715
| EMA period | EMA current | EMA prev | EMA prev2 | | 5 day EMA | 1678.43 | 1672.49 | 1664.46 | | 12 day EMA | 1663.59 | 1658.74 | 1653.32 | | 20 day EMA | 1652.47 | 1648.49 | 1644.27 | | 35 day EMA | 1640.06 | 1637.1 | 1634.07 | | 50 day EMA | 1629.89 | 1627.43 | 1624.94 |
SMA (simple moving average) of Sun Pharma 524715
| SMA period | SMA current | SMA prev | SMA prev2 | | 5 day SMA | 1674.34 | 1667.09 | 1663.08 | | 12 day SMA | 1663.61 | 1658.93 | 1654.56 | | 20 day SMA | 1644.6 | 1642.28 | 1640.66 | | 35 day SMA | 1628.3 | 1624.67 | 1621.97 | | 50 day SMA | 1625.41 | 1623.58 | 1621.69 | | 100 day SMA | 1650.82 | 1650.57 | 1650.52 | | 150 day SMA | 1676.66 | 1675.93 | 1675.12 | | 200 day SMA | 1695.24 | 1695.86 | 1696.46 |
|
|
