NaturalCaps 524654 full analysis,charts,indicators,moving averages,SMA,DMA,EMA,ADX,MACD,RSINatural Caps 524654 WideScreen charts, DMA,SMA,EMA technical analysis, forecast prediction, by indicators ADX,MACD,RSI,CCI BSE stock exchange
Daily price and charts and targets NaturalCaps Strong Daily Stock price targets for NaturalCaps 524654 are 218.73 and 225.58 | Daily Target 1 | 217.58 | | Daily Target 2 | 219.87 | | Daily Target 3 | 224.43333333333 | | Daily Target 4 | 226.72 | | Daily Target 5 | 231.28 |
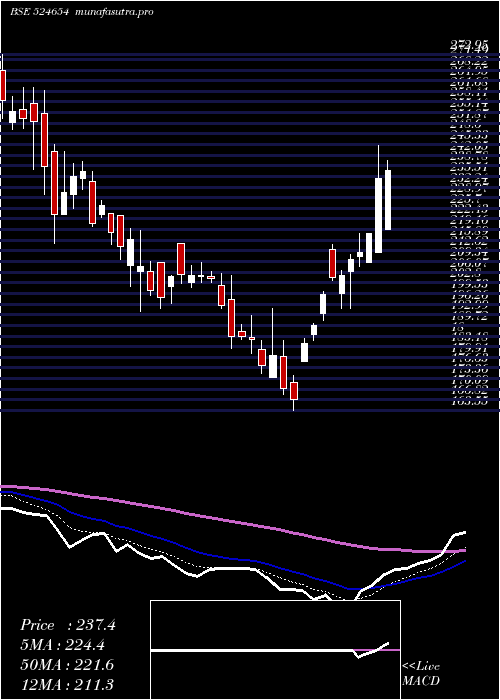
Daily price and volume Natural Caps
| Date |
Closing |
Open |
Range |
Volume |
Thu 23 October 2025 |
222.15 (-2.99%) |
229.00 |
222.15 - 229.00 |
0.4213 times |
Tue 21 October 2025 |
229.00 (3.18%) |
222.40 |
222.40 - 229.00 |
0.1145 times |
Mon 20 October 2025 |
221.95 (0.82%) |
221.95 |
215.10 - 221.95 |
1.8975 times |
Fri 17 October 2025 |
220.15 (-3.02%) |
227.00 |
219.90 - 227.00 |
0.6871 times |
Thu 16 October 2025 |
227.00 (-0.44%) |
228.00 |
223.20 - 228.00 |
0.3667 times |
Wed 15 October 2025 |
228.00 (-0.89%) |
229.20 |
228.00 - 233.95 |
0.165 times |
Tue 14 October 2025 |
230.05 (-1.41%) |
233.35 |
229.20 - 233.35 |
0.0872 times |
Mon 13 October 2025 |
233.35 (-2.36%) |
240.15 |
228.65 - 240.15 |
2.9103 times |
Fri 10 October 2025 |
239.00 (-2.59%) |
236.60 |
236.60 - 256.70 |
1.6747 times |
Thu 09 October 2025 |
245.35 (2.17%) |
243.35 |
238.00 - 249.30 |
1.6758 times |
Wed 08 October 2025 |
240.15 (1.54%) |
237.90 |
228.40 - 244.55 |
0.7617 times |
Weekly price and charts NaturalCaps Strong weekly Stock price targets for NaturalCaps 524654 are 218.63 and 232.53 | Weekly Target 1 | 208.18 | | Weekly Target 2 | 215.17 | | Weekly Target 3 | 222.08333333333 | | Weekly Target 4 | 229.07 | | Weekly Target 5 | 235.98 |
Weekly price and volumes for Natural Caps
| Date |
Closing |
Open |
Range |
Volume |
Thu 23 October 2025 |
222.15 (0.91%) |
221.95 |
215.10 - 229.00 |
0.0832 times |
Fri 17 October 2025 |
220.15 (-7.89%) |
240.15 |
219.90 - 240.15 |
0.1442 times |
Fri 10 October 2025 |
239.00 (-8.78%) |
261.95 |
228.40 - 261.95 |
0.1686 times |
Fri 03 October 2025 |
262.00 (-3.75%) |
272.20 |
259.95 - 290.80 |
0.5071 times |
Fri 26 September 2025 |
272.20 (10.63%) |
278.05 |
215.05 - 296.40 |
5.8458 times |
Fri 19 September 2025 |
246.05 (26.21%) |
193.00 |
186.80 - 246.05 |
0.7801 times |
Fri 12 September 2025 |
194.95 (-6.27%) |
207.25 |
188.20 - 213.75 |
1.2634 times |
Fri 05 September 2025 |
208.00 (6.5%) |
197.35 |
196.20 - 220.75 |
0.3172 times |
Fri 29 August 2025 |
195.30 (-0.91%) |
198.25 |
194.70 - 202.35 |
0.0815 times |
Fri 22 August 2025 |
197.10 (-2.16%) |
201.20 |
195.55 - 212.25 |
0.809 times |
Thu 14 August 2025 |
201.45 (-4.44%) |
214.50 |
199.75 - 224.40 |
0.8834 times |

Monthly price and charts NaturalCaps Strong monthly Stock price targets for NaturalCaps 524654 are 183.18 and 254.08 | Monthly Target 1 | 170.18 | | Monthly Target 2 | 196.17 | | Monthly Target 3 | 241.08333333333 | | Monthly Target 4 | 267.07 | | Monthly Target 5 | 311.98 |
Monthly price and volumes Natural Caps
| Date |
Closing |
Open |
Range |
Volume |
Thu 23 October 2025 |
222.15 (-18.66%) |
280.45 |
215.10 - 286.00 |
0.1464 times |
Tue 30 September 2025 |
273.10 (39.84%) |
197.35 |
186.80 - 296.40 |
2.9449 times |
Fri 29 August 2025 |
195.30 (-8.59%) |
211.55 |
194.70 - 228.00 |
1.0398 times |
Thu 31 July 2025 |
213.65 (-3.15%) |
221.00 |
209.10 - 228.80 |
0.4825 times |
Mon 30 June 2025 |
220.60 (1.59%) |
229.00 |
203.00 - 272.45 |
0.6037 times |
Fri 30 May 2025 |
217.15 (7.58%) |
201.85 |
195.00 - 244.55 |
0.5486 times |
Wed 30 April 2025 |
201.85 (9.58%) |
186.80 |
185.00 - 245.00 |
0.1436 times |
Fri 28 March 2025 |
184.20 (-13.88%) |
208.20 |
163.55 - 219.60 |
1.677 times |
Fri 28 February 2025 |
213.90 (-19.54%) |
266.05 |
210.00 - 298.05 |
0.8966 times |
Fri 31 January 2025 |
265.85 (-2.1%) |
265.05 |
255.00 - 299.00 |
1.517 times |
Tue 31 December 2024 |
271.55 (-7.15%) |
298.60 |
260.25 - 298.80 |
1.2588 times |

DMA SMA EMA moving averages of Natural Caps 524654
DMA (daily moving average) of Natural Caps 524654
| DMA period | DMA value | | 5 day DMA | 224.05 | | 12 day DMA | 231.05 | | 20 day DMA | 242.75 | | 35 day DMA | 227.03 | | 50 day DMA | 219.43 | | 100 day DMA | 220.82 | | 150 day DMA | 214.86 | | 200 day DMA | 225.77 | EMA (exponential moving average) of Natural Caps 524654
| EMA period | EMA current | EMA prev | EMA prev2 | | 5 day EMA | 225.34 | 226.93 | 225.9 | | 12 day EMA | 230.49 | 232 | 232.55 | | 20 day EMA | 231.55 | 232.54 | 232.91 | | 35 day EMA | 227.91 | 228.25 | 228.21 | | 50 day EMA | 219.69 | 219.59 | 219.21 |
SMA (simple moving average) of Natural Caps 524654
| SMA period | SMA current | SMA prev | SMA prev2 | | 5 day SMA | 224.05 | 225.22 | 225.43 | | 12 day SMA | 231.05 | 233.28 | 236.03 | | 20 day SMA | 242.75 | 242.91 | 243.06 | | 35 day SMA | 227.03 | 226.51 | 225.6 | | 50 day SMA | 219.43 | 219.2 | 218.97 | | 100 day SMA | 220.82 | 220.9 | 220.65 | | 150 day SMA | 214.86 | 214.7 | 214.51 | | 200 day SMA | 225.77 | 226.04 | 226.28 |
|
|
