CoralLab 524506 full analysis,charts,indicators,moving averages,SMA,DMA,EMA,ADX,MACD,RSICoral Lab 524506 WideScreen charts, DMA,SMA,EMA technical analysis, forecast prediction, by indicators ADX,MACD,RSI,CCI BSE stock exchange
Daily price and charts and targets CoralLab Strong Daily Stock price targets for CoralLab 524506 are 485.28 and 495.98 | Daily Target 1 | 482.28 | | Daily Target 2 | 488.27 | | Daily Target 3 | 492.98333333333 | | Daily Target 4 | 498.97 | | Daily Target 5 | 503.68 |
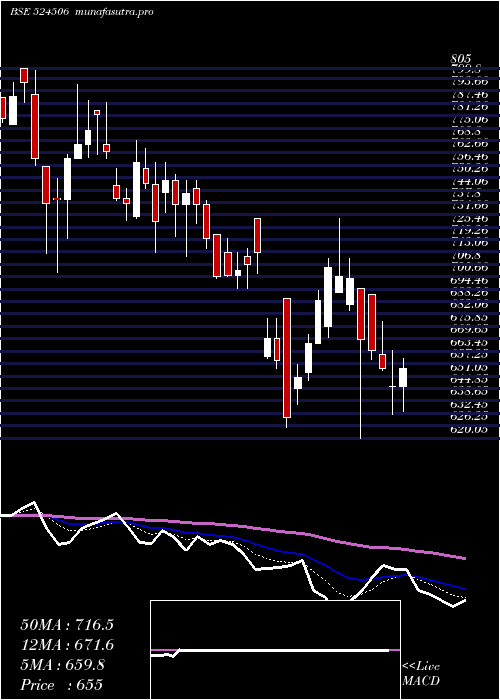
Daily price and volume Coral Lab
| Date |
Closing |
Open |
Range |
Volume |
Wed 03 September 2025 |
494.25 (-0.69%) |
497.70 |
487.00 - 497.70 |
0.518 times |
Tue 02 September 2025 |
497.70 (5.62%) |
471.00 |
465.20 - 503.60 |
3.2022 times |
Mon 01 September 2025 |
471.20 (5.65%) |
454.00 |
449.00 - 475.00 |
1.1269 times |
Fri 29 August 2025 |
446.00 (0.01%) |
445.95 |
444.00 - 456.80 |
0.6468 times |
Thu 28 August 2025 |
445.95 (-2.99%) |
459.55 |
442.55 - 459.55 |
0.7353 times |
Tue 26 August 2025 |
459.70 (-2.67%) |
472.95 |
447.00 - 472.95 |
0.8439 times |
Mon 25 August 2025 |
472.30 (-0.21%) |
473.35 |
470.00 - 477.00 |
0.897 times |
Fri 22 August 2025 |
473.30 (-1.13%) |
478.70 |
470.00 - 481.50 |
0.8094 times |
Thu 21 August 2025 |
478.70 (-0.45%) |
480.90 |
478.00 - 488.00 |
0.758 times |
Wed 20 August 2025 |
480.85 (-0.38%) |
482.00 |
480.00 - 489.00 |
0.4624 times |
Tue 19 August 2025 |
482.70 (0.17%) |
490.50 |
471.00 - 495.00 |
1.9826 times |
Weekly price and charts CoralLab Strong weekly Stock price targets for CoralLab 524506 are 471.63 and 526.23 | Weekly Target 1 | 427.68 | | Weekly Target 2 | 460.97 | | Weekly Target 3 | 482.28333333333 | | Weekly Target 4 | 515.57 | | Weekly Target 5 | 536.88 |
Weekly price and volumes for Coral Lab
| Date |
Closing |
Open |
Range |
Volume |
Wed 03 September 2025 |
494.25 (10.82%) |
454.00 |
449.00 - 503.60 |
0.986 times |
Fri 29 August 2025 |
446.00 (-5.77%) |
473.35 |
442.55 - 477.00 |
0.6353 times |
Fri 22 August 2025 |
473.30 (-3.58%) |
495.00 |
470.00 - 495.00 |
1.2379 times |
Thu 14 August 2025 |
490.85 (-13.43%) |
564.00 |
486.50 - 578.50 |
2.7982 times |
Fri 08 August 2025 |
567.00 (-1.34%) |
582.00 |
565.00 - 594.85 |
0.5356 times |
Fri 01 August 2025 |
574.70 (0.23%) |
574.00 |
570.55 - 595.80 |
0.6805 times |
Fri 25 July 2025 |
573.40 (-3.08%) |
591.50 |
560.70 - 598.00 |
0.6086 times |
Fri 18 July 2025 |
591.65 (-1.46%) |
603.40 |
585.00 - 624.95 |
0.8346 times |
Fri 11 July 2025 |
600.40 (1.05%) |
597.90 |
575.00 - 607.95 |
0.8627 times |
Fri 04 July 2025 |
594.15 (-1.79%) |
613.95 |
581.30 - 613.95 |
0.8207 times |
Fri 27 June 2025 |
605.00 (1.83%) |
590.00 |
567.15 - 608.00 |
1.1858 times |

Monthly price and charts CoralLab Strong monthly Stock price targets for CoralLab 524506 are 471.63 and 526.23 | Monthly Target 1 | 427.68 | | Monthly Target 2 | 460.97 | | Monthly Target 3 | 482.28333333333 | | Monthly Target 4 | 515.57 | | Monthly Target 5 | 536.88 |
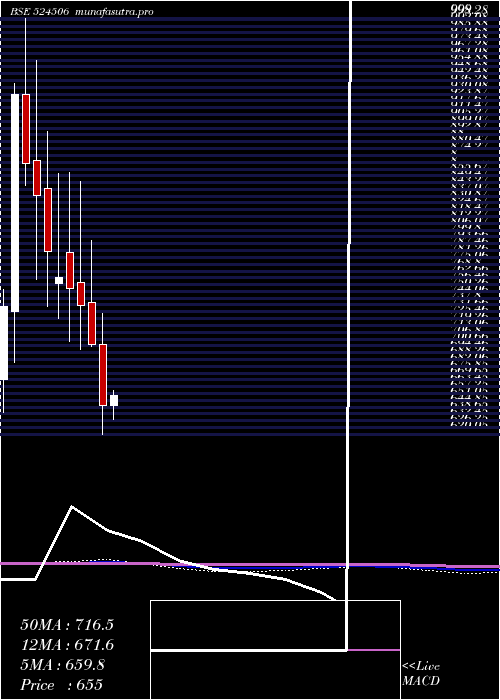
Monthly price and volumes Coral Lab
| Date |
Closing |
Open |
Range |
Volume |
Wed 03 September 2025 |
494.25 (10.82%) |
454.00 |
449.00 - 503.60 |
0.1947 times |
Fri 29 August 2025 |
446.00 (-22.48%) |
578.00 |
442.55 - 594.85 |
1.0477 times |
Thu 31 July 2025 |
575.35 (-3.66%) |
597.10 |
560.70 - 624.95 |
0.6872 times |
Mon 30 June 2025 |
597.20 (-17.66%) |
660.00 |
567.15 - 660.00 |
1.7076 times |
Fri 30 May 2025 |
725.25 (12.27%) |
646.00 |
633.50 - 784.55 |
0.4647 times |
Wed 30 April 2025 |
646.00 (-7.9%) |
701.40 |
620.05 - 730.00 |
0.8039 times |
Fri 28 March 2025 |
701.40 (-4.87%) |
740.00 |
699.95 - 796.95 |
0.5721 times |
Fri 28 February 2025 |
737.30 (-2.09%) |
757.95 |
697.00 - 850.90 |
1.5563 times |
Fri 31 January 2025 |
753.05 (-1.28%) |
785.75 |
704.25 - 859.00 |
1.4169 times |
Tue 31 December 2024 |
762.85 (-3.01%) |
757.10 |
725.50 - 858.00 |
1.549 times |
Fri 29 November 2024 |
786.50 (-6.06%) |
844.00 |
736.90 - 896.00 |
1.7073 times |
DMA SMA EMA moving averages of Coral Lab 524506
DMA (daily moving average) of Coral Lab 524506
| DMA period | DMA value | | 5 day DMA | 471.02 | | 12 day DMA | 473.71 | | 20 day DMA | 508.05 | | 35 day DMA | 540.43 | | 50 day DMA | 556.13 | | 100 day DMA | 612.1 | | 150 day DMA | 660.78 | | 200 day DMA | 694.64 | EMA (exponential moving average) of Coral Lab 524506
| EMA period | EMA current | EMA prev | EMA prev2 | | 5 day EMA | 481.02 | 474.41 | 462.76 | | 12 day EMA | 486.38 | 484.95 | 482.63 | | 20 day EMA | 502.34 | 503.19 | 503.77 | | 35 day EMA | 525.93 | 527.79 | 529.56 | | 50 day EMA | 551.14 | 553.46 | 555.73 |
SMA (simple moving average) of Coral Lab 524506
| SMA period | SMA current | SMA prev | SMA prev2 | | 5 day SMA | 471.02 | 464.11 | 459.03 | | 12 day SMA | 473.71 | 473.43 | 479.62 | | 20 day SMA | 508.05 | 512.5 | 516.35 | | 35 day SMA | 540.43 | 543.32 | 546.25 | | 50 day SMA | 556.13 | 557.86 | 559.79 | | 100 day SMA | 612.1 | 614.22 | 616.28 | | 150 day SMA | 660.78 | 662.57 | 664.19 | | 200 day SMA | 694.64 | 696.29 | 698.03 |
|
|
