IpcaLab 524494 full analysis,charts,indicators,moving averages,SMA,DMA,EMA,ADX,MACD,RSIIpca Lab 524494 WideScreen charts, DMA,SMA,EMA technical analysis, forecast prediction, by indicators ADX,MACD,RSI,CCI BSE stock exchange
Daily price and charts and targets IpcaLab Strong Daily Stock price targets for IpcaLab 524494 are 1437.65 and 1483.05 | Daily Target 1 | 1400.17 | | Daily Target 2 | 1429.73 | | Daily Target 3 | 1445.5666666667 | | Daily Target 4 | 1475.13 | | Daily Target 5 | 1490.97 |
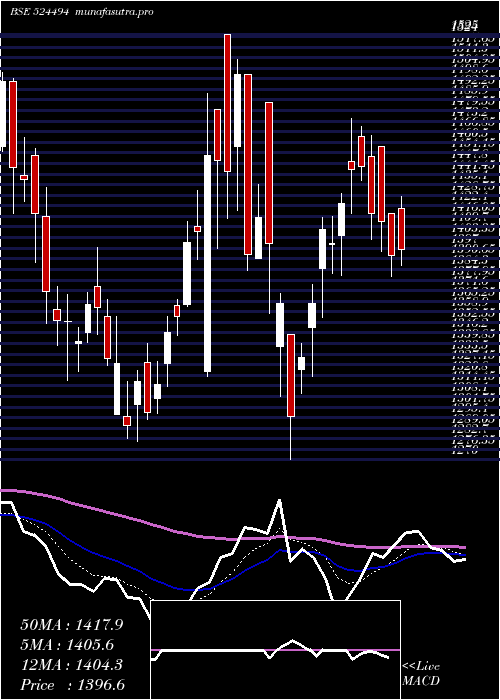
Daily price and volume Ipca Lab
| Date |
Closing |
Open |
Range |
Volume |
Fri 05 December 2025 |
1459.30 (0.15%) |
1447.05 |
1416.00 - 1461.40 |
0.1447 times |
Thu 04 December 2025 |
1457.15 (0.81%) |
1429.95 |
1429.90 - 1469.00 |
0.1022 times |
Wed 03 December 2025 |
1445.50 (1.2%) |
1435.30 |
1417.65 - 1452.65 |
0.0642 times |
Tue 02 December 2025 |
1428.40 (0.49%) |
1420.15 |
1406.55 - 1436.65 |
0.0766 times |
Mon 01 December 2025 |
1421.50 (-2.18%) |
1455.00 |
1410.00 - 1471.10 |
6.7264 times |
Fri 28 November 2025 |
1453.15 (4.25%) |
1380.75 |
1380.75 - 1458.00 |
0.1222 times |
Thu 27 November 2025 |
1393.90 (-0.93%) |
1408.00 |
1389.60 - 1417.25 |
0.038 times |
Wed 26 November 2025 |
1406.95 (0.09%) |
1407.70 |
1386.05 - 1411.25 |
1.1586 times |
Tue 25 November 2025 |
1405.65 (-1.06%) |
1419.75 |
1398.95 - 1440.10 |
1.4329 times |
Mon 24 November 2025 |
1420.75 (-1.6%) |
1443.05 |
1407.00 - 1464.30 |
0.1342 times |
Fri 21 November 2025 |
1443.85 (0.48%) |
1420.75 |
1420.75 - 1455.50 |
0.0845 times |
Weekly price and charts IpcaLab Strong weekly Stock price targets for IpcaLab 524494 are 1432.93 and 1497.48 | Weekly Target 1 | 1381.1 | | Weekly Target 2 | 1420.2 | | Weekly Target 3 | 1445.65 | | Weekly Target 4 | 1484.75 | | Weekly Target 5 | 1510.2 |
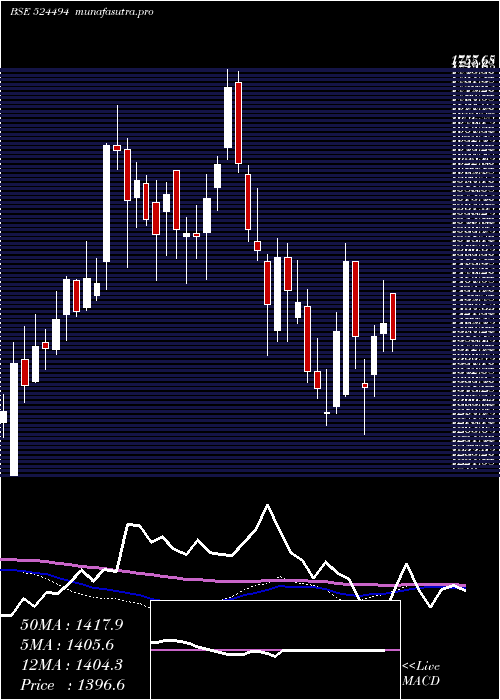
Weekly price and volumes for Ipca Lab
| Date |
Closing |
Open |
Range |
Volume |
Fri 05 December 2025 |
1459.30 (0.42%) |
1455.00 |
1406.55 - 1471.10 |
4.064 times |
Fri 28 November 2025 |
1453.15 (0.64%) |
1443.05 |
1380.75 - 1464.30 |
1.6486 times |
Fri 21 November 2025 |
1443.85 (-3.39%) |
1462.95 |
1419.00 - 1517.50 |
0.6543 times |
Fri 14 November 2025 |
1494.50 (13.07%) |
1301.85 |
1295.00 - 1549.85 |
1.6437 times |
Fri 07 November 2025 |
1321.75 (3.89%) |
1269.15 |
1269.15 - 1333.90 |
0.2438 times |
Fri 31 October 2025 |
1272.20 (-0.13%) |
1301.70 |
1266.80 - 1322.85 |
0.1824 times |
Thu 23 October 2025 |
1273.80 (-0.98%) |
1286.95 |
1262.85 - 1309.95 |
0.926 times |
Fri 17 October 2025 |
1286.35 (-3.59%) |
1333.55 |
1279.35 - 1350.00 |
0.1465 times |
Fri 10 October 2025 |
1334.20 (1.62%) |
1317.70 |
1305.20 - 1404.10 |
0.354 times |
Fri 03 October 2025 |
1312.95 (-4.21%) |
1325.15 |
1307.05 - 1368.60 |
0.1366 times |
Fri 26 September 2025 |
1370.60 (-4.14%) |
1425.45 |
1305.00 - 1425.45 |
0.3228 times |
Monthly price and charts IpcaLab Strong monthly Stock price targets for IpcaLab 524494 are 1432.93 and 1497.48 | Monthly Target 1 | 1381.1 | | Monthly Target 2 | 1420.2 | | Monthly Target 3 | 1445.65 | | Monthly Target 4 | 1484.75 | | Monthly Target 5 | 1510.2 |
Monthly price and volumes Ipca Lab
| Date |
Closing |
Open |
Range |
Volume |
Fri 05 December 2025 |
1459.30 (0.42%) |
1455.00 |
1406.55 - 1471.10 |
2.2774 times |
Fri 28 November 2025 |
1453.15 (14.22%) |
1269.15 |
1269.15 - 1549.85 |
2.3483 times |
Fri 31 October 2025 |
1272.20 (-5.16%) |
1341.35 |
1262.85 - 1404.10 |
0.9351 times |
Tue 30 September 2025 |
1341.35 (-2.86%) |
1379.80 |
1302.00 - 1507.95 |
0.6106 times |
Fri 29 August 2025 |
1380.90 (-6.27%) |
1480.00 |
1325.00 - 1520.45 |
0.9809 times |
Thu 31 July 2025 |
1473.30 (6.12%) |
1388.00 |
1356.00 - 1594.55 |
0.9726 times |
Mon 30 June 2025 |
1388.30 (-2.5%) |
1410.05 |
1322.35 - 1430.35 |
0.538 times |
Fri 30 May 2025 |
1423.95 (1.96%) |
1381.50 |
1326.70 - 1520.00 |
0.5376 times |
Wed 30 April 2025 |
1396.55 (-6.98%) |
1501.30 |
1270.00 - 1501.30 |
0.4576 times |
Fri 28 March 2025 |
1501.30 (10.92%) |
1353.00 |
1281.05 - 1525.00 |
0.3419 times |
Fri 28 February 2025 |
1353.45 (-6.21%) |
1407.85 |
1338.40 - 1530.95 |
0.9772 times |

DMA SMA EMA moving averages of Ipca Lab 524494
DMA (daily moving average) of Ipca Lab 524494
| DMA period | DMA value | | 5 day DMA | 1442.37 | | 12 day DMA | 1431.09 | | 20 day DMA | 1409.41 | | 35 day DMA | 1358.11 | | 50 day DMA | 1354.62 | | 100 day DMA | 1378.86 | | 150 day DMA | 1385.54 | | 200 day DMA | 1390.81 | EMA (exponential moving average) of Ipca Lab 524494
| EMA period | EMA current | EMA prev | EMA prev2 | | 5 day EMA | 1446.46 | 1440.04 | 1431.48 | | 12 day EMA | 1428.4 | 1422.78 | 1416.53 | | 20 day EMA | 1409.2 | 1403.93 | 1398.33 | | 35 day EMA | 1388.24 | 1384.06 | 1379.76 | | 50 day EMA | 1362.28 | 1358.32 | 1354.29 |
SMA (simple moving average) of Ipca Lab 524494
| SMA period | SMA current | SMA prev | SMA prev2 | | 5 day SMA | 1442.37 | 1441.14 | 1428.49 | | 12 day SMA | 1431.09 | 1428.09 | 1428.58 | | 20 day SMA | 1409.41 | 1401.56 | 1393.47 | | 35 day SMA | 1358.11 | 1354.22 | 1350.7 | | 50 day SMA | 1354.62 | 1354.03 | 1351.65 | | 100 day SMA | 1378.86 | 1378.81 | 1378.88 | | 150 day SMA | 1385.54 | 1385.23 | 1384.96 | | 200 day SMA | 1390.81 | 1390.65 | 1390.58 |
|
|
