VinylChem 524129 full analysis,charts,indicators,moving averages,SMA,DMA,EMA,ADX,MACD,RSIVinyl Chem 524129 WideScreen charts, DMA,SMA,EMA technical analysis, forecast prediction, by indicators ADX,MACD,RSI,CCI BSE stock exchange
Daily price and charts and targets VinylChem Strong Daily Stock price targets for VinylChem 524129 are 279.2 and 282.95 | Daily Target 1 | 278.37 | | Daily Target 2 | 280.03 | | Daily Target 3 | 282.11666666667 | | Daily Target 4 | 283.78 | | Daily Target 5 | 285.87 |
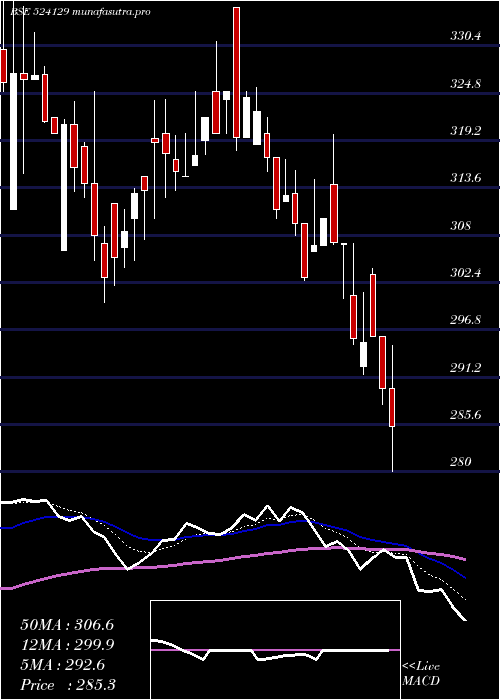
Daily price and volume Vinyl Chem
| Date |
Closing |
Open |
Range |
Volume |
Thu 23 October 2025 |
281.70 (1.04%) |
282.30 |
280.45 - 284.20 |
0.4394 times |
Tue 21 October 2025 |
278.80 (0%) |
278.95 |
278.75 - 278.95 |
0.2341 times |
Mon 20 October 2025 |
278.80 (0.32%) |
278.45 |
277.55 - 281.50 |
0.8396 times |
Fri 17 October 2025 |
277.90 (-0.05%) |
278.15 |
276.00 - 282.50 |
0.8061 times |
Thu 16 October 2025 |
278.05 (-0.98%) |
283.35 |
277.00 - 283.35 |
0.4924 times |
Wed 15 October 2025 |
280.80 (1.54%) |
276.00 |
276.00 - 282.80 |
0.2549 times |
Tue 14 October 2025 |
276.55 (-1.9%) |
284.00 |
272.35 - 284.00 |
1.1175 times |
Mon 13 October 2025 |
281.90 (-0.76%) |
278.65 |
278.65 - 284.00 |
2.8105 times |
Fri 10 October 2025 |
284.05 (-0.33%) |
291.00 |
282.00 - 291.00 |
2.0805 times |
Thu 09 October 2025 |
285.00 (-1.35%) |
288.60 |
283.55 - 289.00 |
0.9249 times |
Wed 08 October 2025 |
288.90 (0.02%) |
293.00 |
285.55 - 323.00 |
8.495 times |
Weekly price and charts VinylChem Strong weekly Stock price targets for VinylChem 524129 are 279.63 and 286.28 | Weekly Target 1 | 274.5 | | Weekly Target 2 | 278.1 | | Weekly Target 3 | 281.15 | | Weekly Target 4 | 284.75 | | Weekly Target 5 | 287.8 |
Weekly price and volumes for Vinyl Chem
| Date |
Closing |
Open |
Range |
Volume |
Thu 23 October 2025 |
281.70 (1.37%) |
278.45 |
277.55 - 284.20 |
0.1569 times |
Fri 17 October 2025 |
277.90 (-2.17%) |
278.65 |
272.35 - 284.00 |
0.5685 times |
Fri 10 October 2025 |
284.05 (-2.35%) |
295.80 |
282.00 - 323.00 |
1.4802 times |
Fri 03 October 2025 |
290.90 (2.94%) |
286.60 |
278.80 - 319.00 |
1.4592 times |
Fri 26 September 2025 |
282.60 (-3.66%) |
293.35 |
280.30 - 308.95 |
1.1425 times |
Fri 19 September 2025 |
293.35 (1.75%) |
285.00 |
281.35 - 309.45 |
1.3163 times |
Fri 12 September 2025 |
288.30 (-4.33%) |
303.10 |
284.10 - 325.00 |
1.6005 times |
Fri 05 September 2025 |
301.35 (11.51%) |
271.50 |
271.50 - 312.00 |
1.3022 times |
Fri 29 August 2025 |
270.25 (-1.15%) |
273.40 |
269.05 - 279.00 |
0.3251 times |
Fri 22 August 2025 |
273.40 (0.57%) |
276.50 |
269.00 - 285.00 |
0.6487 times |
Thu 14 August 2025 |
271.85 (-3.94%) |
280.20 |
270.00 - 284.00 |
0.4042 times |

Monthly price and charts VinylChem Strong monthly Stock price targets for VinylChem 524129 are 277.03 and 327.68 | Monthly Target 1 | 241.7 | | Monthly Target 2 | 261.7 | | Monthly Target 3 | 292.35 | | Monthly Target 4 | 312.35 | | Monthly Target 5 | 343 |
Monthly price and volumes Vinyl Chem
| Date |
Closing |
Open |
Range |
Volume |
Thu 23 October 2025 |
281.70 (-0.23%) |
280.05 |
272.35 - 323.00 |
0.4985 times |
Tue 30 September 2025 |
282.35 (4.48%) |
271.50 |
271.50 - 325.00 |
0.9818 times |
Fri 29 August 2025 |
270.25 (-6.75%) |
289.80 |
269.00 - 294.95 |
0.3055 times |
Thu 31 July 2025 |
289.80 (-9.15%) |
320.10 |
288.00 - 335.00 |
0.5282 times |
Mon 30 June 2025 |
319.00 (4.93%) |
303.00 |
300.00 - 356.90 |
1.3051 times |
Fri 30 May 2025 |
304.00 (10.36%) |
278.30 |
271.15 - 327.00 |
1.0922 times |
Wed 30 April 2025 |
275.45 (-2.6%) |
281.05 |
273.00 - 300.90 |
0.705 times |
Fri 28 March 2025 |
282.80 (25.24%) |
226.05 |
216.50 - 325.65 |
2.3965 times |
Fri 28 February 2025 |
225.80 (-26.12%) |
301.00 |
222.10 - 303.05 |
1.0605 times |
Fri 31 January 2025 |
305.65 (-10.72%) |
344.15 |
275.00 - 366.50 |
1.1267 times |
Tue 31 December 2024 |
342.35 (-3.06%) |
353.50 |
331.70 - 384.70 |
1.089 times |

DMA SMA EMA moving averages of Vinyl Chem 524129
DMA (daily moving average) of Vinyl Chem 524129
| DMA period | DMA value | | 5 day DMA | 279.05 | | 12 day DMA | 281.78 | | 20 day DMA | 284.61 | | 35 day DMA | 289.37 | | 50 day DMA | 285.3 | | 100 day DMA | 298.09 | | 150 day DMA | 291.88 | | 200 day DMA | 292.17 | EMA (exponential moving average) of Vinyl Chem 524129
| EMA period | EMA current | EMA prev | EMA prev2 | | 5 day EMA | 280.01 | 279.17 | 279.35 | | 12 day EMA | 281.72 | 281.72 | 282.25 | | 20 day EMA | 283.55 | 283.74 | 284.26 | | 35 day EMA | 283.89 | 284.02 | 284.33 | | 50 day EMA | 284.44 | 284.55 | 284.78 |
SMA (simple moving average) of Vinyl Chem 524129
| SMA period | SMA current | SMA prev | SMA prev2 | | 5 day SMA | 279.05 | 278.87 | 278.42 | | 12 day SMA | 281.78 | 282.7 | 283.71 | | 20 day SMA | 284.61 | 285.25 | 286.02 | | 35 day SMA | 289.37 | 289.55 | 289.57 | | 50 day SMA | 285.3 | 285.32 | 285.43 | | 100 day SMA | 298.09 | 298.3 | 298.55 | | 150 day SMA | 291.88 | 291.62 | 291.3 | | 200 day SMA | 292.17 | 292.48 | 292.81 |
|
|
