PantherIndustrial 524055 full analysis,charts,indicators,moving averages,SMA,DMA,EMA,ADX,MACD,RSIPanther Industrial 524055 WideScreen charts, DMA,SMA,EMA technical analysis, forecast prediction, by indicators ADX,MACD,RSI,CCI BSE stock exchange
Daily price and charts and targets PantherIndustrial Strong Daily Stock price targets for PantherIndustrial 524055 are 50.97 and 50.97 | Daily Target 1 | 50.97 | | Daily Target 2 | 50.97 | | Daily Target 3 | 50.97 | | Daily Target 4 | 50.97 | | Daily Target 5 | 50.97 |
Daily price and volume Panther Industrial
| Date |
Closing |
Open |
Range |
Volume |
Fri 05 December 2025 |
50.97 (4.98%) |
50.97 |
50.97 - 50.97 |
0.2299 times |
Thu 04 December 2025 |
48.55 (0%) |
50.97 |
48.55 - 50.97 |
0.3448 times |
Thu 27 November 2025 |
48.55 (-3.86%) |
53.02 |
48.55 - 53.02 |
0.4828 times |
Wed 26 November 2025 |
50.50 (4.99%) |
50.50 |
50.50 - 50.50 |
3.4483 times |
Tue 25 November 2025 |
48.10 (0.21%) |
48.00 |
48.00 - 50.40 |
2.3448 times |
Mon 24 November 2025 |
48.00 (-4%) |
48.00 |
48.00 - 48.00 |
0.023 times |
Fri 21 November 2025 |
50.00 (0%) |
50.00 |
50.00 - 50.00 |
0.7816 times |
Tue 18 November 2025 |
50.00 (-3.85%) |
50.00 |
50.00 - 50.00 |
0.023 times |
Mon 17 November 2025 |
52.00 (-2.26%) |
53.22 |
52.00 - 53.22 |
2.2989 times |
Fri 14 November 2025 |
53.20 (-4.93%) |
53.20 |
53.20 - 53.20 |
0.023 times |
Thu 13 November 2025 |
55.96 (0%) |
55.96 |
55.96 - 55.96 |
0.2299 times |
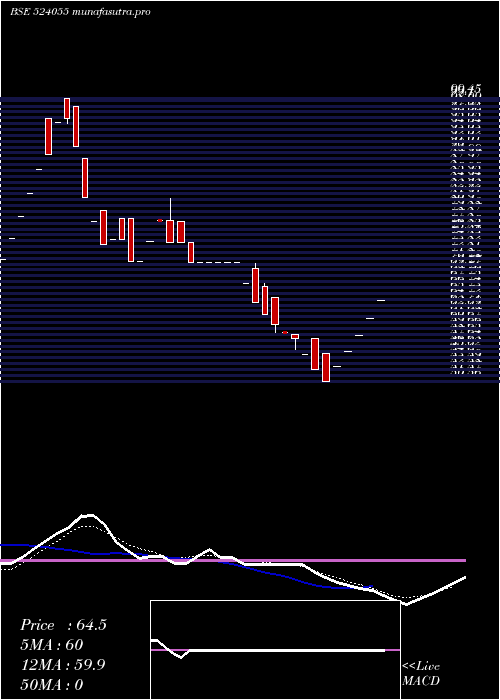
Weekly price and charts PantherIndustrial Strong weekly Stock price targets for PantherIndustrial 524055 are 49.76 and 52.18 | Weekly Target 1 | 47.74 | | Weekly Target 2 | 49.36 | | Weekly Target 3 | 50.163333333333 | | Weekly Target 4 | 51.78 | | Weekly Target 5 | 52.58 |
Weekly price and volumes for Panther Industrial
| Date |
Closing |
Open |
Range |
Volume |
Fri 05 December 2025 |
50.97 (4.98%) |
50.97 |
48.55 - 50.97 |
0.0385 times |
Thu 27 November 2025 |
48.55 (-2.9%) |
48.00 |
48.00 - 53.02 |
0.4219 times |
Fri 21 November 2025 |
50.00 (-6.02%) |
53.22 |
50.00 - 53.22 |
0.2079 times |
Fri 14 November 2025 |
53.20 (-14.19%) |
58.90 |
53.20 - 61.84 |
0.154 times |
Fri 31 October 2025 |
62.00 (1.64%) |
67.16 |
62.00 - 70.00 |
0.0924 times |
Thu 23 October 2025 |
61.00 (-4.69%) |
64.00 |
61.00 - 64.00 |
0.3326 times |
Fri 17 October 2025 |
64.00 (5.45%) |
60.69 |
60.69 - 64.35 |
0.3819 times |
Thu 09 October 2025 |
60.69 (2.43%) |
59.50 |
59.50 - 60.69 |
3.7573 times |
Mon 22 September 2025 |
59.25 (-0.42%) |
59.25 |
59.25 - 59.25 |
0.4635 times |
Fri 19 September 2025 |
59.50 (-4.45%) |
61.03 |
59.50 - 61.03 |
4.15 times |
Thu 11 September 2025 |
62.27 (11.4%) |
58.69 |
58.69 - 62.27 |
22.9396 times |
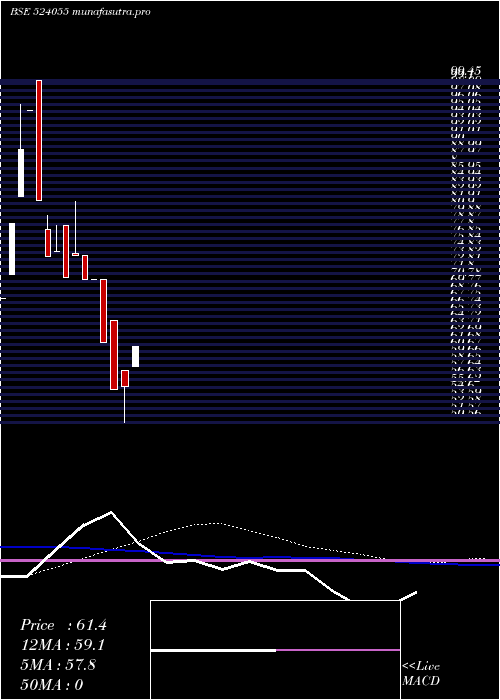
Monthly price and charts PantherIndustrial Strong monthly Stock price targets for PantherIndustrial 524055 are 49.76 and 52.18 | Monthly Target 1 | 47.74 | | Monthly Target 2 | 49.36 | | Monthly Target 3 | 50.163333333333 | | Monthly Target 4 | 51.78 | | Monthly Target 5 | 52.58 |
Monthly price and volumes Panther Industrial
| Date |
Closing |
Open |
Range |
Volume |
Fri 05 December 2025 |
50.97 (4.98%) |
50.97 |
48.55 - 50.97 |
0.002 times |
Thu 27 November 2025 |
48.55 (-21.69%) |
58.90 |
48.00 - 61.84 |
0.0408 times |
Fri 31 October 2025 |
62.00 (4.64%) |
59.50 |
59.50 - 70.00 |
0.2374 times |
Mon 22 September 2025 |
59.25 (22.37%) |
46.00 |
46.00 - 62.27 |
3.7327 times |
Fri 29 August 2025 |
48.42 (-26.99%) |
65.00 |
48.42 - 65.00 |
0.0115 times |
Wed 30 July 2025 |
66.32 (9.82%) |
59.05 |
50.56 - 71.85 |
4.8642 times |
Mon 30 June 2025 |
60.39 (-15.06%) |
71.00 |
59.00 - 71.00 |
0.4208 times |
Wed 28 May 2025 |
71.10 (-9%) |
80.09 |
71.00 - 82.20 |
0.5695 times |
Tue 29 April 2025 |
78.13 (-1.1%) |
82.95 |
78.13 - 99.45 |
0.0891 times |
Fri 28 March 2025 |
79.00 (21.54%) |
68.25 |
68.25 - 79.00 |
0.032 times |
Thu 27 February 2025 |
65.00 (3.6%) |
65.00 |
65.00 - 65.00 |
0.008 times |

DMA SMA EMA moving averages of Panther Industrial 524055
DMA (daily moving average) of Panther Industrial 524055
| DMA period | DMA value | | 5 day DMA | 49.33 | | 12 day DMA | 50.98 | | 20 day DMA | 55.72 | | 35 day DMA | 57.17 | | 50 day DMA | 57.35 | | 100 day DMA | | | 150 day DMA | | | 200 day DMA | | EMA (exponential moving average) of Panther Industrial 524055
| EMA period | EMA current | EMA prev | EMA prev2 | | 5 day EMA | 49.82 | 49.25 | 49.6 | | 12 day EMA | 51.65 | 51.77 | 52.36 | | 20 day EMA | 53.71 | 54 | 54.57 | | 35 day EMA | 55.82 | 56.11 | 56.56 | | 50 day EMA | 57.54 | 57.81 | 58.19 |
SMA (simple moving average) of Panther Industrial 524055
| SMA period | SMA current | SMA prev | SMA prev2 | | 5 day SMA | 49.33 | 48.74 | 49.03 | | 12 day SMA | 50.98 | 51.64 | 52.76 | | 20 day SMA | 55.72 | 56.36 | 56.97 | | 35 day SMA | 57.17 | 57.09 | 57.02 | | 50 day SMA | 57.35 | 57.71 | 58.15 | | 100 day SMA | | 150 day SMA | | 200 day SMA |
|
|
