GolkundaDia 523676 full analysis,charts,indicators,moving averages,SMA,DMA,EMA,ADX,MACD,RSIGolkunda Dia 523676 WideScreen charts, DMA,SMA,EMA technical analysis, forecast prediction, by indicators ADX,MACD,RSI,CCI BSE stock exchange
Daily price and charts and targets GolkundaDia Strong Daily Stock price targets for GolkundaDia 523676 are 189.45 and 197.45 | Daily Target 1 | 182.97 | | Daily Target 2 | 187.93 | | Daily Target 3 | 190.96666666667 | | Daily Target 4 | 195.93 | | Daily Target 5 | 198.97 |
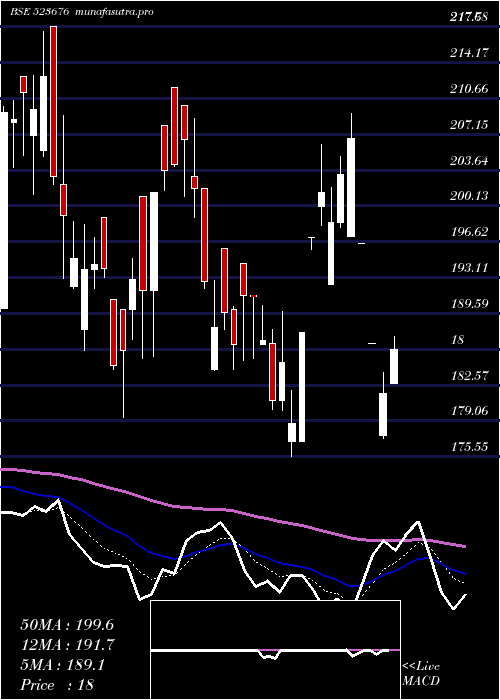
Daily price and volume Golkunda Dia
| Date |
Closing |
Open |
Range |
Volume |
Fri 05 December 2025 |
192.90 (1.9%) |
186.00 |
186.00 - 194.00 |
0.5905 times |
Thu 04 December 2025 |
189.30 (-1.02%) |
186.20 |
186.20 - 191.70 |
0.6051 times |
Wed 03 December 2025 |
191.25 (0.16%) |
190.10 |
188.85 - 193.70 |
0.1868 times |
Tue 02 December 2025 |
190.95 (-2.2%) |
195.40 |
190.00 - 197.00 |
1.7222 times |
Mon 01 December 2025 |
195.25 (-0.79%) |
195.15 |
190.00 - 205.75 |
1.0244 times |
Fri 28 November 2025 |
196.80 (2.39%) |
194.80 |
190.00 - 198.30 |
1.9241 times |
Thu 27 November 2025 |
192.20 (-0.21%) |
190.90 |
190.90 - 194.95 |
0.8422 times |
Wed 26 November 2025 |
192.60 (-1.41%) |
195.35 |
192.55 - 196.25 |
1.1523 times |
Tue 25 November 2025 |
195.35 (0.05%) |
196.40 |
193.45 - 196.40 |
0.38 times |
Mon 24 November 2025 |
195.25 (-1.91%) |
186.00 |
186.00 - 196.65 |
1.5724 times |
Fri 21 November 2025 |
199.05 (-1.12%) |
205.25 |
196.00 - 205.25 |
0.7878 times |
Weekly price and charts GolkundaDia Strong weekly Stock price targets for GolkundaDia 523676 are 179.58 and 199.33 | Weekly Target 1 | 175.13 | | Weekly Target 2 | 184.02 | | Weekly Target 3 | 194.88333333333 | | Weekly Target 4 | 203.77 | | Weekly Target 5 | 214.63 |
Weekly price and volumes for Golkunda Dia
| Date |
Closing |
Open |
Range |
Volume |
Fri 05 December 2025 |
192.90 (-1.98%) |
195.15 |
186.00 - 205.75 |
0.189 times |
Fri 28 November 2025 |
196.80 (-1.13%) |
186.00 |
186.00 - 198.30 |
0.2688 times |
Fri 21 November 2025 |
199.05 (-2.86%) |
207.80 |
196.00 - 207.80 |
0.2732 times |
Fri 14 November 2025 |
204.90 (0.44%) |
207.90 |
201.65 - 210.00 |
0.3233 times |
Fri 07 November 2025 |
204.00 (-1.57%) |
208.25 |
202.00 - 216.50 |
0.3985 times |
Fri 31 October 2025 |
207.25 (-6.12%) |
229.70 |
200.65 - 229.70 |
1.9355 times |
Thu 23 October 2025 |
220.75 (21.22%) |
200.00 |
190.00 - 254.70 |
5.7791 times |
Fri 17 October 2025 |
182.10 (7.12%) |
169.50 |
166.30 - 187.00 |
0.5349 times |
Fri 10 October 2025 |
170.00 (-1.25%) |
170.35 |
156.00 - 179.50 |
0.2318 times |
Fri 03 October 2025 |
172.15 (-0.26%) |
172.70 |
169.10 - 179.85 |
0.0659 times |
Fri 26 September 2025 |
172.60 (1.11%) |
169.50 |
169.50 - 183.00 |
0.2098 times |

Monthly price and charts GolkundaDia Strong monthly Stock price targets for GolkundaDia 523676 are 179.58 and 199.33 | Monthly Target 1 | 175.13 | | Monthly Target 2 | 184.02 | | Monthly Target 3 | 194.88333333333 | | Monthly Target 4 | 203.77 | | Monthly Target 5 | 214.63 |
Monthly price and volumes Golkunda Dia
| Date |
Closing |
Open |
Range |
Volume |
Fri 05 December 2025 |
192.90 (-1.98%) |
195.15 |
186.00 - 205.75 |
0.1016 times |
Fri 28 November 2025 |
196.80 (-5.04%) |
208.25 |
186.00 - 216.50 |
0.6792 times |
Fri 31 October 2025 |
207.25 (22.09%) |
169.75 |
156.00 - 254.70 |
4.5775 times |
Tue 30 September 2025 |
169.75 (0.95%) |
169.55 |
168.00 - 183.00 |
0.4694 times |
Fri 29 August 2025 |
168.15 (-5.51%) |
175.00 |
165.45 - 180.90 |
0.32 times |
Thu 31 July 2025 |
177.95 (-3.81%) |
187.75 |
174.00 - 189.20 |
0.7455 times |
Mon 30 June 2025 |
185.00 (0.49%) |
184.10 |
177.65 - 190.00 |
0.7976 times |
Fri 30 May 2025 |
184.10 (-1.29%) |
194.50 |
175.55 - 209.20 |
0.8985 times |
Wed 30 April 2025 |
186.50 (-4.36%) |
188.00 |
179.35 - 211.75 |
0.5881 times |
Fri 28 March 2025 |
195.00 (-15.68%) |
240.00 |
190.10 - 244.95 |
0.8227 times |
Fri 28 February 2025 |
231.25 (-0.17%) |
227.95 |
213.00 - 265.00 |
0.9761 times |

DMA SMA EMA moving averages of Golkunda Dia 523676
DMA (daily moving average) of Golkunda Dia 523676
| DMA period | DMA value | | 5 day DMA | 191.93 | | 12 day DMA | 194.35 | | 20 day DMA | 198.29 | | 35 day DMA | 200.53 | | 50 day DMA | 192.17 | | 100 day DMA | 183.89 | | 150 day DMA | 184.9 | | 200 day DMA | 192.6 | EMA (exponential moving average) of Golkunda Dia 523676
| EMA period | EMA current | EMA prev | EMA prev2 | | 5 day EMA | 192.16 | 191.79 | 193.04 | | 12 day EMA | 194.47 | 194.76 | 195.75 | | 20 day EMA | 195.89 | 196.2 | 196.93 | | 35 day EMA | 193.15 | 193.17 | 193.4 | | 50 day EMA | 190.46 | 190.36 | 190.4 |
SMA (simple moving average) of Golkunda Dia 523676
| SMA period | SMA current | SMA prev | SMA prev2 | | 5 day SMA | 191.93 | 192.71 | 193.29 | | 12 day SMA | 194.35 | 194.97 | 196.15 | | 20 day SMA | 198.29 | 198.84 | 199.65 | | 35 day SMA | 200.53 | 199.9 | 199.35 | | 50 day SMA | 192.17 | 191.73 | 191.38 | | 100 day SMA | 183.89 | 183.77 | 183.69 | | 150 day SMA | 184.9 | 184.87 | 184.89 | | 200 day SMA | 192.6 | 192.77 | 192.98 |
|
|
