NationalFer 523630 full analysis,charts,indicators,moving averages,SMA,DMA,EMA,ADX,MACD,RSINational Fer 523630 WideScreen charts, DMA,SMA,EMA technical analysis, forecast prediction, by indicators ADX,MACD,RSI,CCI BSE stock exchange
Daily price and charts and targets NationalFer Strong Daily Stock price targets for NationalFer 523630 are 93.22 and 94.72 | Daily Target 1 | 92.94 | | Daily Target 2 | 93.49 | | Daily Target 3 | 94.443333333333 | | Daily Target 4 | 94.99 | | Daily Target 5 | 95.94 |
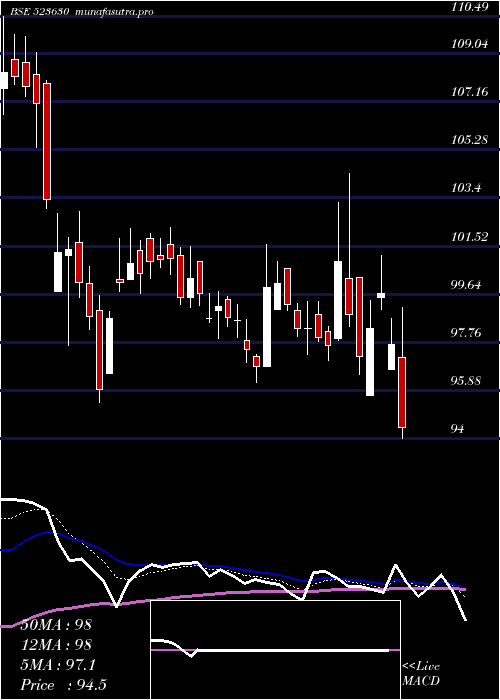
Daily price and volume National Fer
| Date |
Closing |
Open |
Range |
Volume |
Thu 23 October 2025 |
94.03 (-0.52%) |
95.01 |
93.90 - 95.40 |
0.9353 times |
Tue 21 October 2025 |
94.52 (1.04%) |
93.36 |
93.36 - 95.34 |
0.3622 times |
Mon 20 October 2025 |
93.55 (0.15%) |
93.43 |
92.50 - 93.87 |
0.7182 times |
Fri 17 October 2025 |
93.41 (-2.87%) |
96.00 |
93.15 - 96.00 |
0.7037 times |
Thu 16 October 2025 |
96.17 (0.96%) |
95.27 |
95.27 - 98.35 |
2.908 times |
Wed 15 October 2025 |
95.26 (2.46%) |
92.70 |
92.25 - 95.89 |
1.2636 times |
Tue 14 October 2025 |
92.97 (-0.92%) |
93.50 |
92.00 - 94.05 |
1.4077 times |
Mon 13 October 2025 |
93.83 (0.59%) |
92.31 |
92.31 - 94.07 |
0.3303 times |
Fri 10 October 2025 |
93.28 (0.47%) |
92.84 |
92.80 - 93.75 |
0.4605 times |
Thu 09 October 2025 |
92.84 (-0.14%) |
92.01 |
92.01 - 93.43 |
0.9106 times |
Wed 08 October 2025 |
92.97 (-0.79%) |
94.11 |
92.85 - 94.36 |
0.2556 times |
Weekly price and charts NationalFer Strong weekly Stock price targets for NationalFer 523630 are 93.27 and 96.17 | Weekly Target 1 | 91.08 | | Weekly Target 2 | 92.55 | | Weekly Target 3 | 93.976666666667 | | Weekly Target 4 | 95.45 | | Weekly Target 5 | 96.88 |
Weekly price and volumes for National Fer
| Date |
Closing |
Open |
Range |
Volume |
Thu 23 October 2025 |
94.03 (0.66%) |
93.43 |
92.50 - 95.40 |
0.1854 times |
Fri 17 October 2025 |
93.41 (0.14%) |
92.31 |
92.00 - 98.35 |
0.6082 times |
Fri 10 October 2025 |
93.28 (-2.27%) |
95.11 |
92.01 - 95.95 |
0.3697 times |
Fri 03 October 2025 |
95.45 (3.61%) |
92.06 |
91.00 - 95.72 |
0.5858 times |
Fri 26 September 2025 |
92.12 (-6.44%) |
98.38 |
91.40 - 98.38 |
0.9869 times |
Fri 19 September 2025 |
98.46 (0.9%) |
97.90 |
97.40 - 101.31 |
1.2845 times |
Fri 12 September 2025 |
97.58 (-1.25%) |
99.02 |
97.20 - 99.76 |
0.9898 times |
Fri 05 September 2025 |
98.82 (2.8%) |
96.17 |
96.17 - 103.00 |
2.0825 times |
Fri 29 August 2025 |
96.13 (-2.18%) |
98.36 |
92.77 - 99.06 |
1.0003 times |
Fri 22 August 2025 |
98.27 (7.32%) |
91.60 |
89.70 - 99.95 |
1.907 times |
Thu 14 August 2025 |
91.57 (-1.45%) |
93.02 |
91.39 - 94.50 |
0.7674 times |

Monthly price and charts NationalFer Strong monthly Stock price targets for NationalFer 523630 are 92.92 and 99.46 | Monthly Target 1 | 88.19 | | Monthly Target 2 | 91.11 | | Monthly Target 3 | 94.73 | | Monthly Target 4 | 97.65 | | Monthly Target 5 | 101.27 |
Monthly price and volumes National Fer
| Date |
Closing |
Open |
Range |
Volume |
Thu 23 October 2025 |
94.03 (2.18%) |
92.05 |
91.81 - 98.35 |
0.2077 times |
Tue 30 September 2025 |
92.02 (-4.28%) |
96.17 |
91.00 - 103.00 |
0.8145 times |
Fri 29 August 2025 |
96.13 (-1.61%) |
97.16 |
89.70 - 99.95 |
0.7639 times |
Thu 31 July 2025 |
97.70 (-3.28%) |
101.60 |
95.70 - 104.35 |
0.8898 times |
Mon 30 June 2025 |
101.01 (2.57%) |
98.00 |
95.33 - 112.11 |
1.6423 times |
Fri 30 May 2025 |
98.48 (15.98%) |
83.89 |
78.69 - 102.07 |
2.0815 times |
Wed 30 April 2025 |
84.91 (5.65%) |
80.58 |
74.90 - 91.34 |
1.282 times |
Fri 28 March 2025 |
80.37 (2.84%) |
78.98 |
73.67 - 87.00 |
0.811 times |
Fri 28 February 2025 |
78.15 (-27.2%) |
103.70 |
78.00 - 104.80 |
0.5745 times |
Fri 31 January 2025 |
107.35 (-7.34%) |
115.20 |
96.10 - 122.50 |
0.9329 times |
Tue 31 December 2024 |
115.85 (-5.16%) |
122.05 |
112.20 - 129.70 |
1.2991 times |

DMA SMA EMA moving averages of National Fer 523630
DMA (daily moving average) of National Fer 523630
| DMA period | DMA value | | 5 day DMA | 94.34 | | 12 day DMA | 93.88 | | 20 day DMA | 93.87 | | 35 day DMA | 95.83 | | 50 day DMA | 95.58 | | 100 day DMA | 97.75 | | 150 day DMA | 93.9 | | 200 day DMA | 95.63 | EMA (exponential moving average) of National Fer 523630
| EMA period | EMA current | EMA prev | EMA prev2 | | 5 day EMA | 94.14 | 94.19 | 94.03 | | 12 day EMA | 94.17 | 94.2 | 94.14 | | 20 day EMA | 94.44 | 94.48 | 94.48 | | 35 day EMA | 94.72 | 94.76 | 94.77 | | 50 day EMA | 95.37 | 95.42 | 95.46 |
SMA (simple moving average) of National Fer 523630
| SMA period | SMA current | SMA prev | SMA prev2 | | 5 day SMA | 94.34 | 94.58 | 94.27 | | 12 day SMA | 93.88 | 93.91 | 93.98 | | 20 day SMA | 93.87 | 93.96 | 94.08 | | 35 day SMA | 95.83 | 95.94 | 96.03 | | 50 day SMA | 95.58 | 95.56 | 95.53 | | 100 day SMA | 97.75 | 97.81 | 97.87 | | 150 day SMA | 93.9 | 93.83 | 93.74 | | 200 day SMA | 95.63 | 95.74 | 95.84 |
|
|
