DredgingCor 523618 full analysis,charts,indicators,moving averages,SMA,DMA,EMA,ADX,MACD,RSIDredging Cor 523618 WideScreen charts, DMA,SMA,EMA technical analysis, forecast prediction, by indicators ADX,MACD,RSI,CCI BSE stock exchange
Daily price and charts and targets DredgingCor Strong Daily Stock price targets for DredgingCor 523618 are 862.13 and 920.43 | Daily Target 1 | 818.12 | | Daily Target 2 | 847.83 | | Daily Target 3 | 876.41666666667 | | Daily Target 4 | 906.13 | | Daily Target 5 | 934.72 |
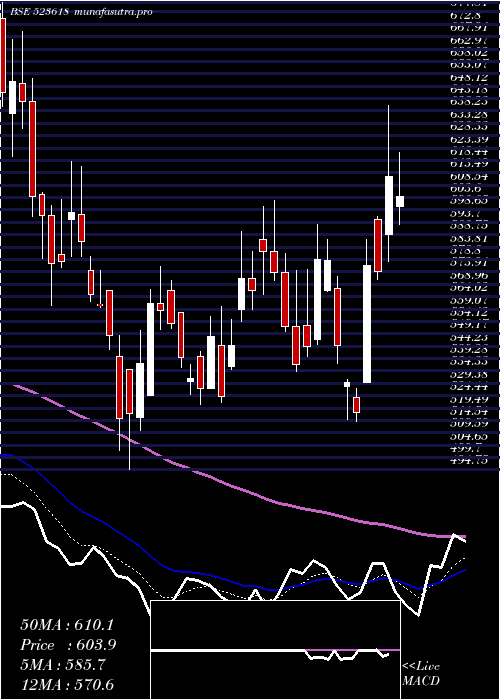
Daily price and volume Dredging Cor
| Date |
Closing |
Open |
Range |
Volume |
Fri 05 December 2025 |
877.55 (2.33%) |
859.30 |
846.70 - 905.00 |
3.3759 times |
Thu 04 December 2025 |
857.55 (-1.35%) |
867.15 |
850.45 - 885.65 |
0.3382 times |
Wed 03 December 2025 |
869.30 (-1.72%) |
879.60 |
860.00 - 880.90 |
0.2405 times |
Tue 02 December 2025 |
884.55 (-0.65%) |
885.05 |
868.00 - 905.85 |
1.201 times |
Mon 01 December 2025 |
890.30 (3.79%) |
852.25 |
852.00 - 896.80 |
1.4788 times |
Fri 28 November 2025 |
857.75 (5.28%) |
815.30 |
815.30 - 886.20 |
1.9694 times |
Thu 27 November 2025 |
814.70 (-0.83%) |
821.05 |
803.65 - 822.00 |
0.1719 times |
Wed 26 November 2025 |
821.50 (-0.41%) |
837.95 |
815.65 - 837.95 |
0.3207 times |
Tue 25 November 2025 |
824.85 (-0.67%) |
831.50 |
818.00 - 858.00 |
0.5701 times |
Mon 24 November 2025 |
830.45 (-3.63%) |
855.60 |
824.90 - 855.60 |
0.3333 times |
Fri 21 November 2025 |
861.70 (-2.06%) |
885.00 |
850.30 - 885.80 |
1.6985 times |
Weekly price and charts DredgingCor Strong weekly Stock price targets for DredgingCor 523618 are 862.13 and 921.28 | Weekly Target 1 | 817.55 | | Weekly Target 2 | 847.55 | | Weekly Target 3 | 876.7 | | Weekly Target 4 | 906.7 | | Weekly Target 5 | 935.85 |
Weekly price and volumes for Dredging Cor
| Date |
Closing |
Open |
Range |
Volume |
Fri 05 December 2025 |
877.55 (2.31%) |
852.25 |
846.70 - 905.85 |
0.8374 times |
Fri 28 November 2025 |
857.75 (-0.46%) |
855.60 |
803.65 - 886.20 |
0.4248 times |
Fri 21 November 2025 |
861.70 (9.26%) |
788.70 |
770.05 - 885.80 |
0.664 times |
Fri 14 November 2025 |
788.70 (-7.54%) |
850.50 |
770.75 - 880.95 |
0.4879 times |
Fri 07 November 2025 |
853.00 (15.15%) |
780.05 |
780.00 - 954.95 |
3.3703 times |
Fri 31 October 2025 |
740.80 (18.4%) |
621.35 |
618.00 - 773.00 |
3.7595 times |
Thu 23 October 2025 |
625.65 (3.9%) |
629.10 |
600.35 - 649.60 |
0.0756 times |
Fri 17 October 2025 |
602.15 (-2.14%) |
616.50 |
561.70 - 616.50 |
0.0973 times |
Fri 10 October 2025 |
615.30 (-3.53%) |
643.55 |
610.10 - 648.75 |
0.1667 times |
Fri 03 October 2025 |
637.80 (1.04%) |
628.00 |
606.10 - 643.05 |
0.1164 times |
Fri 26 September 2025 |
631.25 (-4.72%) |
662.60 |
625.00 - 723.00 |
0.5863 times |

Monthly price and charts DredgingCor Strong monthly Stock price targets for DredgingCor 523618 are 862.13 and 921.28 | Monthly Target 1 | 817.55 | | Monthly Target 2 | 847.55 | | Monthly Target 3 | 876.7 | | Monthly Target 4 | 906.7 | | Monthly Target 5 | 935.85 |
Monthly price and volumes Dredging Cor
| Date |
Closing |
Open |
Range |
Volume |
Fri 05 December 2025 |
877.55 (2.31%) |
852.25 |
846.70 - 905.85 |
0.4155 times |
Fri 28 November 2025 |
857.75 (15.79%) |
780.05 |
770.05 - 954.95 |
2.4547 times |
Fri 31 October 2025 |
740.80 (20.06%) |
617.75 |
561.70 - 773.00 |
2.0699 times |
Tue 30 September 2025 |
617.00 (5.05%) |
588.60 |
588.60 - 723.00 |
0.5295 times |
Fri 29 August 2025 |
587.35 (-12.27%) |
671.45 |
586.10 - 675.00 |
0.187 times |
Thu 31 July 2025 |
669.50 (-6%) |
712.00 |
665.30 - 733.45 |
0.3005 times |
Mon 30 June 2025 |
712.20 (-12.18%) |
818.95 |
680.30 - 822.25 |
0.4325 times |
Fri 30 May 2025 |
811.00 (40.64%) |
579.00 |
545.35 - 828.60 |
2.51 times |
Wed 30 April 2025 |
576.65 (5.95%) |
546.95 |
513.95 - 640.90 |
0.5794 times |
Fri 28 March 2025 |
544.25 (5.59%) |
534.95 |
494.75 - 602.35 |
0.5208 times |
Fri 28 February 2025 |
515.45 (-32.55%) |
750.05 |
502.50 - 750.05 |
0.2163 times |

DMA SMA EMA moving averages of Dredging Cor 523618
DMA (daily moving average) of Dredging Cor 523618
| DMA period | DMA value | | 5 day DMA | 875.85 | | 12 day DMA | 855.83 | | 20 day DMA | 840.4 | | 35 day DMA | 779.12 | | 50 day DMA | 737.06 | | 100 day DMA | 696.78 | | 150 day DMA | 698.46 | | 200 day DMA | 669.74 | EMA (exponential moving average) of Dredging Cor 523618
| EMA period | EMA current | EMA prev | EMA prev2 | | 5 day EMA | 867.85 | 863 | 865.73 | | 12 day EMA | 852.89 | 848.41 | 846.75 | | 20 day EMA | 832.54 | 827.8 | 824.67 | | 35 day EMA | 788.63 | 783.4 | 779.03 | | 50 day EMA | 743.89 | 738.44 | 733.58 |
SMA (simple moving average) of Dredging Cor 523618
| SMA period | SMA current | SMA prev | SMA prev2 | | 5 day SMA | 875.85 | 871.89 | 863.32 | | 12 day SMA | 855.83 | 849.48 | 843.32 | | 20 day SMA | 840.4 | 840.18 | 842.71 | | 35 day SMA | 779.12 | 771.47 | 764.55 | | 50 day SMA | 737.06 | 732.76 | 728.68 | | 100 day SMA | 696.78 | 694.91 | 693.27 | | 150 day SMA | 698.46 | 696.5 | 694.68 | | 200 day SMA | 669.74 | 668.84 | 668.37 |
|
|
