SikaInter 523606 full analysis,charts,indicators,moving averages,SMA,DMA,EMA,ADX,MACD,RSISika Inter 523606 WideScreen charts, DMA,SMA,EMA technical analysis, forecast prediction, by indicators ADX,MACD,RSI,CCI BSE stock exchange
Daily price and charts and targets SikaInter Strong Daily Stock price targets for SikaInter 523606 are 883.88 and 916.43 | Daily Target 1 | 858.33 | | Daily Target 2 | 876.87 | | Daily Target 3 | 890.88333333333 | | Daily Target 4 | 909.42 | | Daily Target 5 | 923.43 |
Daily price and volume Sika Inter
| Date |
Closing |
Open |
Range |
Volume |
Fri 05 December 2025 |
895.40 (0.02%) |
895.00 |
872.35 - 904.90 |
0.8178 times |
Thu 04 December 2025 |
895.20 (-1.53%) |
918.65 |
880.00 - 918.65 |
0.8745 times |
Wed 03 December 2025 |
909.10 (-1.51%) |
928.40 |
885.10 - 948.80 |
2.2438 times |
Tue 02 December 2025 |
923.05 (-6.63%) |
988.75 |
905.65 - 996.45 |
1.4611 times |
Mon 01 December 2025 |
988.55 (-0.74%) |
1004.95 |
981.50 - 1004.95 |
0.4803 times |
Fri 28 November 2025 |
995.90 (1.59%) |
970.00 |
970.00 - 998.75 |
0.645 times |
Thu 27 November 2025 |
980.35 (-0.73%) |
987.55 |
962.30 - 1009.65 |
0.7287 times |
Wed 26 November 2025 |
987.55 (0.61%) |
981.55 |
960.15 - 996.90 |
0.9665 times |
Tue 25 November 2025 |
981.55 (-1.71%) |
991.00 |
972.00 - 1009.90 |
0.6053 times |
Mon 24 November 2025 |
998.60 (-3.51%) |
1025.05 |
975.00 - 1039.85 |
1.1771 times |
Fri 21 November 2025 |
1034.90 (0.44%) |
1040.00 |
1012.40 - 1045.00 |
0.5959 times |
Weekly price and charts SikaInter Strong weekly Stock price targets for SikaInter 523606 are 817.58 and 950.18 | Weekly Target 1 | 791.63 | | Weekly Target 2 | 843.52 | | Weekly Target 3 | 924.23333333333 | | Weekly Target 4 | 976.12 | | Weekly Target 5 | 1056.83 |
Weekly price and volumes for Sika Inter
| Date |
Closing |
Open |
Range |
Volume |
Fri 05 December 2025 |
895.40 (-10.09%) |
1004.95 |
872.35 - 1004.95 |
1.1243 times |
Fri 28 November 2025 |
995.90 (-3.77%) |
1025.05 |
960.15 - 1039.85 |
0.7886 times |
Fri 21 November 2025 |
1034.90 (-4.33%) |
1071.10 |
1012.40 - 1109.95 |
0.5999 times |
Fri 14 November 2025 |
1081.75 (0.32%) |
1088.40 |
1030.35 - 1120.00 |
0.9109 times |
Fri 07 November 2025 |
1078.35 (-8.17%) |
1170.00 |
995.00 - 1218.70 |
1.2268 times |
Fri 31 October 2025 |
1174.30 (-2.32%) |
1205.15 |
1170.00 - 1217.90 |
0.6738 times |
Thu 23 October 2025 |
1202.25 (-0.41%) |
1220.00 |
1192.45 - 1239.00 |
0.3549 times |
Fri 17 October 2025 |
1207.25 (-3.66%) |
1258.80 |
1175.00 - 1264.95 |
1.0713 times |
Fri 10 October 2025 |
1253.15 (1.47%) |
1247.20 |
1230.00 - 1335.00 |
1.881 times |
Fri 03 October 2025 |
1235.00 (2.38%) |
1210.00 |
1151.00 - 1249.00 |
1.3685 times |
Fri 26 September 2025 |
1206.30 (-0.01%) |
1235.00 |
1190.00 - 1337.00 |
3.7237 times |
Monthly price and charts SikaInter Strong monthly Stock price targets for SikaInter 523606 are 817.58 and 950.18 | Monthly Target 1 | 791.63 | | Monthly Target 2 | 843.52 | | Monthly Target 3 | 924.23333333333 | | Monthly Target 4 | 976.12 | | Monthly Target 5 | 1056.83 |
Monthly price and volumes Sika Inter
| Date |
Closing |
Open |
Range |
Volume |
Fri 05 December 2025 |
895.40 (-10.09%) |
1004.95 |
872.35 - 1004.95 |
0.112 times |
Fri 28 November 2025 |
995.90 (-15.19%) |
1170.00 |
960.15 - 1218.70 |
0.3514 times |
Fri 31 October 2025 |
1174.30 (0.58%) |
1189.95 |
1155.35 - 1335.00 |
0.4626 times |
Tue 30 September 2025 |
1167.50 (2%) |
1149.70 |
1100.00 - 1337.00 |
0.8318 times |
Fri 29 August 2025 |
1144.65 (-6.21%) |
1212.00 |
1120.00 - 1365.00 |
0.809 times |
Thu 31 July 2025 |
1220.50 (-11.49%) |
1400.00 |
1041.55 - 1498.50 |
1.08 times |
Mon 30 June 2025 |
1378.95 (66.66%) |
820.85 |
812.50 - 1624.95 |
4.0634 times |
Fri 30 May 2025 |
827.40 (22.04%) |
677.80 |
626.10 - 890.00 |
1.2678 times |
Wed 30 April 2025 |
677.95 (5.94%) |
649.00 |
602.00 - 787.35 |
0.5974 times |
Fri 28 March 2025 |
639.95 (-72.34%) |
2320.00 |
493.00 - 2549.00 |
0.4246 times |
Fri 28 February 2025 |
2313.45 (6.8%) |
2260.00 |
2152.30 - 2660.00 |
0.0808 times |
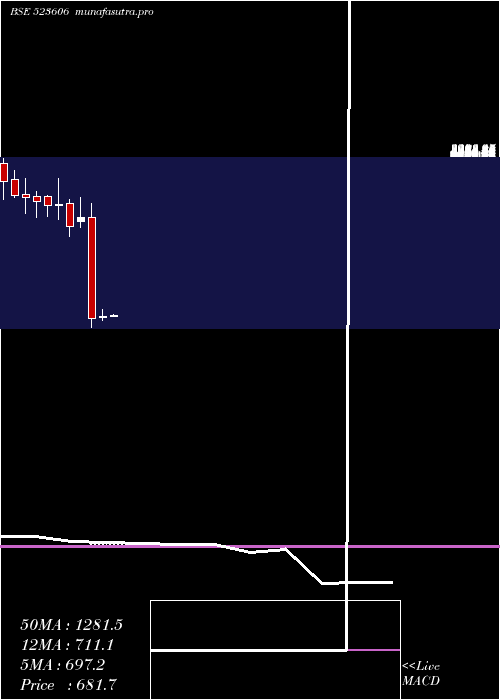
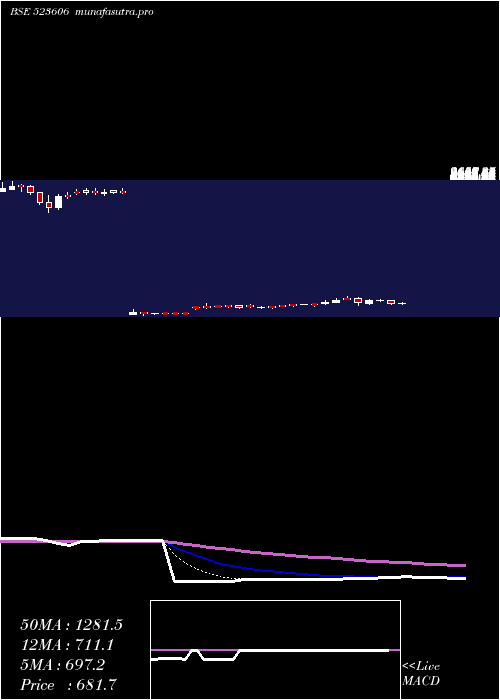
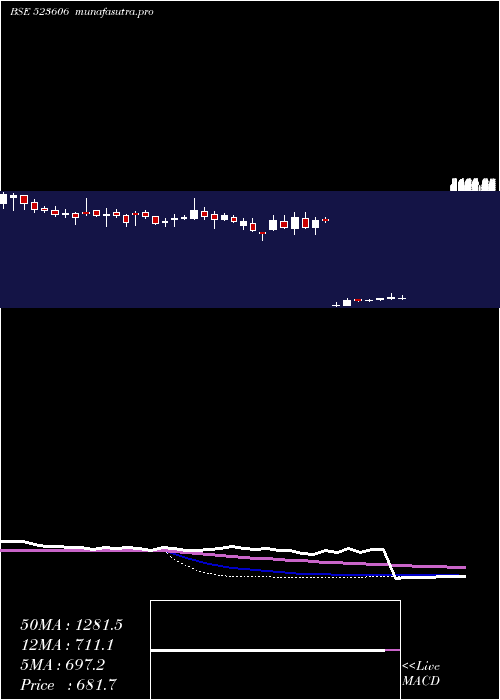
DMA SMA EMA moving averages of Sika Inter 523606
DMA (daily moving average) of Sika Inter 523606
| DMA period | DMA value | | 5 day DMA | 922.26 | | 12 day DMA | 968.38 | | 20 day DMA | 1009.65 | | 35 day DMA | 1088.17 | | 50 day DMA | 1135.16 | | 100 day DMA | 1163.41 | | 150 day DMA | 1132.13 | | 200 day DMA | 1249.04 | EMA (exponential moving average) of Sika Inter 523606
| EMA period | EMA current | EMA prev | EMA prev2 | | 5 day EMA | 919.67 | 931.8 | 950.1 | | 12 day EMA | 964.64 | 977.23 | 992.14 | | 20 day EMA | 1005.22 | 1016.78 | 1029.57 | | 35 day EMA | 1061.58 | 1071.36 | 1081.73 | | 50 day EMA | 1118.26 | 1127.35 | 1136.82 |
SMA (simple moving average) of Sika Inter 523606
| SMA period | SMA current | SMA prev | SMA prev2 | | 5 day SMA | 922.26 | 942.36 | 959.39 | | 12 day SMA | 968.38 | 982.38 | 997.49 | | 20 day SMA | 1009.65 | 1019.95 | 1033.89 | | 35 day SMA | 1088.17 | 1097.59 | 1107.82 | | 50 day SMA | 1135.16 | 1141.38 | 1147.23 | | 100 day SMA | 1163.41 | 1168.15 | 1173.08 | | 150 day SMA | 1132.13 | 1131 | 1129.68 | | 200 day SMA | 1249.04 | 1256 | 1262.35 |
|
|
