PacificInd 523483 full analysis,charts,indicators,moving averages,SMA,DMA,EMA,ADX,MACD,RSIPacific Ind 523483 WideScreen charts, DMA,SMA,EMA technical analysis, forecast prediction, by indicators ADX,MACD,RSI,CCI BSE stock exchange
Daily price and charts and targets PacificInd Strong Daily Stock price targets for PacificInd 523483 are 208 and 218.5 | Daily Target 1 | 206.2 | | Daily Target 2 | 209.8 | | Daily Target 3 | 216.7 | | Daily Target 4 | 220.3 | | Daily Target 5 | 227.2 |
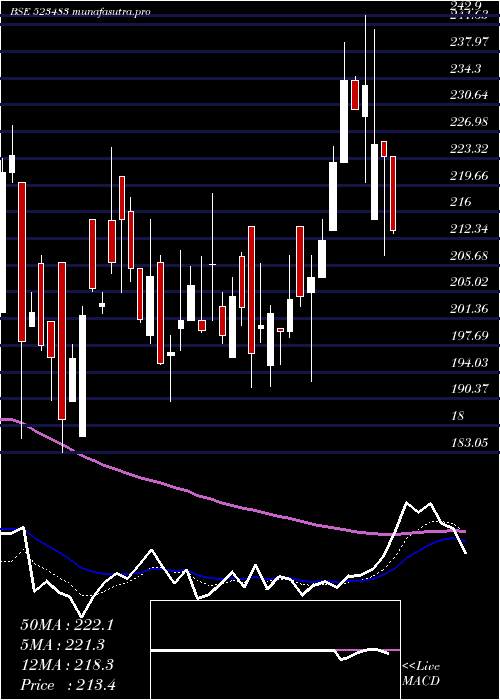
Daily price and volume Pacific Ind
| Date |
Closing |
Open |
Range |
Volume |
| Wed 30 April 2025 |
213.40 (-4.56%) |
223.60 |
213.10 - 223.60 |
0.0032 times |
| Tue 29 April 2025 |
223.60 (-0.73%) |
225.60 |
210.00 - 225.60 |
0.0391 times |
| Mon 28 April 2025 |
225.25 (-3.47%) |
215.00 |
215.00 - 240.95 |
0.0839 times |
| Fri 25 April 2025 |
233.35 (1.46%) |
229.00 |
220.00 - 242.90 |
0.0125 times |
| Thu 24 April 2025 |
230.00 (-1.69%) |
234.00 |
230.00 - 234.50 |
0.8209 times |
| Tue 22 April 2025 |
233.95 (5.03%) |
222.75 |
222.75 - 239.25 |
1.2233 times |
| Mon 21 April 2025 |
222.75 (5.05%) |
213.50 |
213.50 - 225.00 |
1.9978 times |
| Thu 17 April 2025 |
212.05 (2.44%) |
207.00 |
207.00 - 214.90 |
2.8393 times |
| Wed 16 April 2025 |
207.00 (1.25%) |
205.00 |
192.75 - 209.95 |
1.4953 times |
| Tue 15 April 2025 |
204.45 (0.22%) |
213.95 |
203.00 - 213.95 |
1.4847 times |
| Fri 11 April 2025 |
204.00 (2.18%) |
199.65 |
198.85 - 210.00 |
0.1239 times |
Weekly price and charts PacificInd Strong weekly Stock price targets for PacificInd 523483 are 196.23 and 227.18 | Weekly Target 1 | 190.5 | | Weekly Target 2 | 201.95 | | Weekly Target 3 | 221.45 | | Weekly Target 4 | 232.9 | | Weekly Target 5 | 252.4 |
Weekly price and volumes for Pacific Ind
| Date |
Closing |
Open |
Range |
Volume |
| Wed 30 April 2025 |
213.40 (-8.55%) |
215.00 |
210.00 - 240.95 |
0.0811 times |
| Fri 25 April 2025 |
233.35 (10.04%) |
213.50 |
213.50 - 242.90 |
2.605 times |
| Thu 17 April 2025 |
212.05 (3.95%) |
213.95 |
192.75 - 214.90 |
3.7389 times |
| Fri 11 April 2025 |
204.00 (1.77%) |
195.00 |
192.05 - 210.00 |
0.2221 times |
| Fri 04 April 2025 |
200.45 (-1.91%) |
209.85 |
192.00 - 213.95 |
0.1591 times |
| Fri 28 March 2025 |
204.35 (-0.78%) |
201.10 |
196.05 - 218.50 |
0.6781 times |
| Fri 21 March 2025 |
205.95 (2.36%) |
199.00 |
190.00 - 215.00 |
0.7355 times |
| Thu 13 March 2025 |
201.20 (-1.11%) |
214.85 |
200.90 - 224.80 |
0.2078 times |
| Fri 07 March 2025 |
203.45 (3.8%) |
209.05 |
183.05 - 215.00 |
0.4884 times |
| Fri 28 February 2025 |
196.00 (-12.4%) |
220.00 |
185.00 - 220.00 |
1.084 times |
| Fri 21 February 2025 |
223.75 (6.4%) |
229.95 |
190.00 - 229.95 |
0.2025 times |

Monthly price and charts PacificInd Strong monthly Stock price targets for PacificInd 523483 are 202.7 and 253.6 | Monthly Target 1 | 165.2 | | Monthly Target 2 | 189.3 | | Monthly Target 3 | 216.1 | | Monthly Target 4 | 240.2 | | Monthly Target 5 | 267 |
Monthly price and volumes Pacific Ind
| Date |
Closing |
Open |
Range |
Volume |
| Wed 30 April 2025 |
213.40 (4.43%) |
209.85 |
192.00 - 242.90 |
0.8398 times |
| Fri 28 March 2025 |
204.35 (4.26%) |
209.05 |
183.05 - 224.80 |
0.2603 times |
| Fri 28 February 2025 |
196.00 (-23.81%) |
266.95 |
185.00 - 277.90 |
0.2756 times |
| Fri 31 January 2025 |
257.25 (-16.73%) |
308.95 |
245.00 - 320.50 |
0.3478 times |
| Tue 31 December 2024 |
308.95 (-1.97%) |
308.05 |
292.50 - 343.95 |
0.1711 times |
| Fri 29 November 2024 |
315.15 (-4.79%) |
337.00 |
280.35 - 367.00 |
0.2804 times |
| Thu 31 October 2024 |
331.00 (-9.74%) |
366.10 |
288.00 - 374.00 |
0.276 times |
| Mon 30 September 2024 |
366.70 (29.51%) |
283.00 |
268.05 - 410.90 |
3.8391 times |
| Fri 30 August 2024 |
283.15 (5.46%) |
270.00 |
222.00 - 312.00 |
2.9086 times |
| Wed 31 July 2024 |
268.50 (14.23%) |
243.95 |
223.40 - 299.00 |
0.8012 times |
| Fri 28 June 2024 |
235.05 (5.36%) |
232.80 |
201.00 - 245.95 |
0.6601 times |

DMA SMA EMA moving averages of Pacific Ind 523483
DMA (daily moving average) of Pacific Ind 523483
| DMA period | DMA value | | 5 day DMA | 225.12 | | 12 day DMA | 217.45 | | 20 day DMA | 211.17 | | 35 day DMA | 207.24 | | 50 day DMA | 210.22 | | 100 day DMA | 254.96 | | 150 day DMA | 281.01 | | 200 day DMA | 277.48 | EMA (exponential moving average) of Pacific Ind 523483
| EMA period | EMA current | EMA prev | EMA prev2 | | 5 day EMA | 221.27 | 225.21 | 226.02 | | 12 day EMA | 218.32 | 219.22 | 218.42 | | 20 day EMA | 215.25 | 215.44 | 214.58 | | 35 day EMA | 215.23 | 215.34 | 214.85 | | 50 day EMA | 216.04 | 216.15 | 215.85 |
SMA (simple moving average) of Pacific Ind 523483
| SMA period | SMA current | SMA prev | SMA prev2 | | 5 day SMA | 225.12 | 229.23 | 229.06 | | 12 day SMA | 217.45 | 216.5 | 214.58 | | 20 day SMA | 211.17 | 210.8 | 209.68 | | 35 day SMA | 207.24 | 206.79 | 206.18 | | 50 day SMA | 210.22 | 211.43 | 212.41 | | 100 day SMA | 254.96 | 255.94 | 256.73 | | 150 day SMA | 281.01 | 281.52 | 281.99 | | 200 day SMA | 277.48 | 277.63 | 277.69 |
|
|
