IndBank 523465 full analysis,charts,indicators,moving averages,SMA,DMA,EMA,ADX,MACD,RSIInd Bank 523465 WideScreen charts, DMA,SMA,EMA technical analysis, forecast prediction, by indicators ADX,MACD,RSI,CCI BSE stock exchange
Daily price and charts and targets IndBank Strong Daily Stock price targets for IndBank 523465 are 38.48 and 39.48 | Daily Target 1 | 38.3 | | Daily Target 2 | 38.66 | | Daily Target 3 | 39.303333333333 | | Daily Target 4 | 39.66 | | Daily Target 5 | 40.3 |
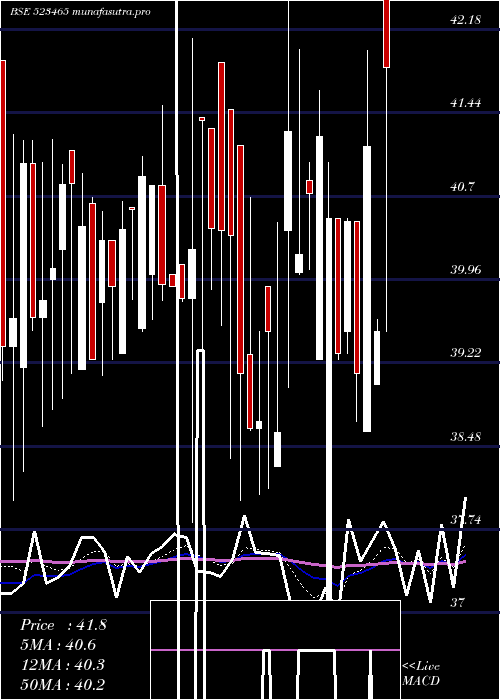
Daily price and volume Ind Bank
| Date |
Closing |
Open |
Range |
Volume |
Tue 21 October 2025 |
39.01 (0.39%) |
39.95 |
38.95 - 39.95 |
0.2217 times |
Mon 20 October 2025 |
38.86 (2.37%) |
38.38 |
37.06 - 39.00 |
0.7441 times |
Fri 17 October 2025 |
37.96 (-0.37%) |
38.20 |
37.91 - 39.25 |
0.0706 times |
Thu 16 October 2025 |
38.10 (-1.17%) |
39.40 |
37.55 - 39.40 |
0.4435 times |
Wed 15 October 2025 |
38.55 (-1.91%) |
39.38 |
38.50 - 40.00 |
0.7429 times |
Tue 14 October 2025 |
39.30 (-2.38%) |
39.68 |
39.26 - 40.28 |
3.1244 times |
Mon 13 October 2025 |
40.26 (-0.79%) |
40.88 |
39.64 - 41.48 |
3.028 times |
Fri 10 October 2025 |
40.58 (2.14%) |
40.13 |
39.13 - 40.99 |
0.5652 times |
Thu 09 October 2025 |
39.73 (0.84%) |
39.25 |
39.12 - 40.14 |
0.6569 times |
Wed 08 October 2025 |
39.40 (-2.11%) |
40.00 |
39.38 - 41.00 |
0.4026 times |
Tue 07 October 2025 |
40.25 (-0.54%) |
40.76 |
39.61 - 43.00 |
1.6489 times |
Weekly price and charts IndBank Strong weekly Stock price targets for IndBank 523465 are 38.04 and 40.93 | Weekly Target 1 | 35.78 | | Weekly Target 2 | 37.4 | | Weekly Target 3 | 38.673333333333 | | Weekly Target 4 | 40.29 | | Weekly Target 5 | 41.56 |
Weekly price and volumes for Ind Bank
| Date |
Closing |
Open |
Range |
Volume |
Tue 21 October 2025 |
39.01 (2.77%) |
38.38 |
37.06 - 39.95 |
0.2544 times |
Fri 17 October 2025 |
37.96 (-6.46%) |
40.88 |
37.55 - 41.48 |
1.9514 times |
Fri 10 October 2025 |
40.58 (1.45%) |
41.00 |
39.11 - 43.00 |
2.0302 times |
Fri 03 October 2025 |
40.00 (2.3%) |
39.10 |
38.00 - 41.00 |
0.5497 times |
Fri 26 September 2025 |
39.10 (-4.28%) |
41.85 |
39.00 - 41.85 |
0.4446 times |
Fri 19 September 2025 |
40.85 (1.42%) |
38.30 |
38.30 - 42.79 |
1.461 times |
Fri 12 September 2025 |
40.28 (0.7%) |
40.85 |
35.50 - 41.90 |
0.9048 times |
Fri 05 September 2025 |
40.00 (5.01%) |
39.99 |
38.26 - 42.00 |
0.7908 times |
Fri 29 August 2025 |
38.09 (-2.16%) |
39.25 |
38.06 - 40.29 |
0.859 times |
Fri 22 August 2025 |
38.93 (-4.33%) |
41.00 |
38.50 - 41.00 |
0.7541 times |
Thu 14 August 2025 |
40.69 (1.65%) |
38.00 |
38.00 - 40.85 |
0.4579 times |

Monthly price and charts IndBank Strong monthly Stock price targets for IndBank 523465 are 35.07 and 41.01 | Monthly Target 1 | 33.75 | | Monthly Target 2 | 36.38 | | Monthly Target 3 | 39.69 | | Monthly Target 4 | 42.32 | | Monthly Target 5 | 45.63 |
Monthly price and volumes Ind Bank
| Date |
Closing |
Open |
Range |
Volume |
Tue 21 October 2025 |
39.01 (-2.94%) |
40.10 |
37.06 - 43.00 |
1.1104 times |
Tue 30 September 2025 |
40.19 (5.51%) |
39.99 |
35.50 - 42.79 |
0.9186 times |
Fri 29 August 2025 |
38.09 (-2.43%) |
39.00 |
38.00 - 41.49 |
0.6719 times |
Thu 31 July 2025 |
39.04 (-2.16%) |
40.09 |
37.00 - 42.92 |
0.983 times |
Mon 30 June 2025 |
39.90 (-2.01%) |
40.00 |
38.00 - 41.90 |
1.0393 times |
Fri 30 May 2025 |
40.72 (7.21%) |
38.50 |
33.00 - 44.70 |
1.2511 times |
Wed 30 April 2025 |
37.98 (-4.02%) |
44.90 |
35.07 - 44.90 |
0.8605 times |
Fri 28 March 2025 |
39.57 (-8.64%) |
43.31 |
35.30 - 46.69 |
0.9509 times |
Fri 28 February 2025 |
43.31 (-11.12%) |
46.35 |
38.60 - 49.79 |
0.4792 times |
Fri 31 January 2025 |
48.73 (-4.92%) |
51.25 |
44.00 - 55.00 |
1.7349 times |
Tue 31 December 2024 |
51.25 (10%) |
47.75 |
47.50 - 56.50 |
2.4107 times |

DMA SMA EMA moving averages of Ind Bank 523465
DMA (daily moving average) of Ind Bank 523465
| DMA period | DMA value | | 5 day DMA | 38.5 | | 12 day DMA | 39.37 | | 20 day DMA | 39.61 | | 35 day DMA | 39.91 | | 50 day DMA | 39.76 | | 100 day DMA | 39.96 | | 150 day DMA | 40.05 | | 200 day DMA | 41.84 | EMA (exponential moving average) of Ind Bank 523465
| EMA period | EMA current | EMA prev | EMA prev2 | | 5 day EMA | 38.82 | 38.72 | 38.65 | | 12 day EMA | 39.17 | 39.2 | 39.26 | | 20 day EMA | 39.43 | 39.47 | 39.53 | | 35 day EMA | 39.6 | 39.63 | 39.68 | | 50 day EMA | 39.69 | 39.72 | 39.76 |
SMA (simple moving average) of Ind Bank 523465
| SMA period | SMA current | SMA prev | SMA prev2 | | 5 day SMA | 38.5 | 38.55 | 38.83 | | 12 day SMA | 39.37 | 39.46 | 39.55 | | 20 day SMA | 39.61 | 39.7 | 39.8 | | 35 day SMA | 39.91 | 39.94 | 39.91 | | 50 day SMA | 39.76 | 39.78 | 39.81 | | 100 day SMA | 39.96 | 39.97 | 39.99 | | 150 day SMA | 40.05 | 40.08 | 40.12 | | 200 day SMA | 41.84 | 41.9 | 41.96 |
|
|
