EldecoHous 523329 full analysis,charts,indicators,moving averages,SMA,DMA,EMA,ADX,MACD,RSIEldeco Hous 523329 WideScreen charts, DMA,SMA,EMA technical analysis, forecast prediction, by indicators ADX,MACD,RSI,CCI BSE stock exchange
Daily price and charts and targets EldecoHous Strong Daily Stock price targets for EldecoHous 523329 are 950.9 and 1029.9 | Daily Target 1 | 888.27 | | Daily Target 2 | 934.53 | | Daily Target 3 | 967.26666666667 | | Daily Target 4 | 1013.53 | | Daily Target 5 | 1046.27 |
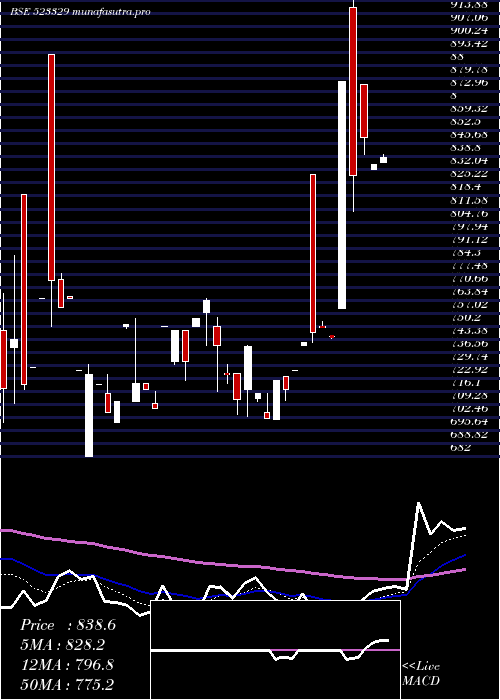
Daily price and volume Eldeco Hous
| Date |
Closing |
Open |
Range |
Volume |
Fri 05 December 2025 |
980.80 (3.91%) |
959.95 |
921.00 - 1000.00 |
2.3818 times |
Thu 04 December 2025 |
943.85 (16.87%) |
848.00 |
848.00 - 969.10 |
5.3238 times |
Tue 02 December 2025 |
807.60 (0.24%) |
805.00 |
762.05 - 808.80 |
0.8533 times |
Mon 01 December 2025 |
805.65 (3.81%) |
834.95 |
800.00 - 834.95 |
0.7821 times |
Fri 28 November 2025 |
776.05 (-2.71%) |
823.80 |
776.00 - 823.80 |
0.0453 times |
Thu 27 November 2025 |
797.65 (0%) |
797.65 |
797.65 - 797.65 |
0.0032 times |
Wed 26 November 2025 |
797.65 (0%) |
797.65 |
797.65 - 797.65 |
0.0032 times |
Tue 25 November 2025 |
797.65 (0%) |
797.65 |
797.65 - 797.65 |
0.0049 times |
Mon 24 November 2025 |
797.65 (0.89%) |
732.95 |
732.95 - 800.00 |
0.5408 times |
Fri 21 November 2025 |
790.60 (-4.52%) |
787.10 |
787.10 - 840.00 |
0.0615 times |
Thu 20 November 2025 |
828.00 (-3.94%) |
905.15 |
792.05 - 905.15 |
0.4663 times |
Weekly price and charts EldecoHous Strong weekly Stock price targets for EldecoHous 523329 are 871.43 and 1109.38 | Weekly Target 1 | 676.33 | | Weekly Target 2 | 828.57 | | Weekly Target 3 | 914.28333333333 | | Weekly Target 4 | 1066.52 | | Weekly Target 5 | 1152.23 |
Weekly price and volumes for Eldeco Hous
| Date |
Closing |
Open |
Range |
Volume |
Fri 05 December 2025 |
980.80 (26.38%) |
834.95 |
762.05 - 1000.00 |
4.6152 times |
Fri 28 November 2025 |
776.05 (-1.84%) |
732.95 |
732.95 - 823.80 |
0.2952 times |
Fri 21 November 2025 |
790.60 (-7.98%) |
859.10 |
787.10 - 917.50 |
0.2728 times |
Fri 14 November 2025 |
859.15 (-2.15%) |
878.00 |
851.40 - 1022.00 |
0.76 times |
Fri 07 November 2025 |
878.00 (0.23%) |
871.00 |
843.50 - 1006.00 |
0.8976 times |
Fri 31 October 2025 |
876.00 (4.77%) |
895.00 |
870.00 - 945.20 |
0.86 times |
Thu 23 October 2025 |
836.10 (-3.9%) |
860.00 |
836.10 - 860.00 |
0.044 times |
Fri 17 October 2025 |
870.00 (8.75%) |
810.00 |
797.65 - 888.90 |
1.1696 times |
Fri 10 October 2025 |
800.00 (-0.07%) |
790.65 |
753.00 - 836.00 |
0.7488 times |
Fri 03 October 2025 |
800.60 (0.14%) |
805.00 |
785.10 - 874.80 |
0.3368 times |
Fri 26 September 2025 |
799.45 (-0.86%) |
806.40 |
776.10 - 807.00 |
1.4216 times |

Monthly price and charts EldecoHous Strong monthly Stock price targets for EldecoHous 523329 are 871.43 and 1109.38 | Monthly Target 1 | 676.33 | | Monthly Target 2 | 828.57 | | Monthly Target 3 | 914.28333333333 | | Monthly Target 4 | 1066.52 | | Monthly Target 5 | 1152.23 |
Monthly price and volumes Eldeco Hous
| Date |
Closing |
Open |
Range |
Volume |
Fri 05 December 2025 |
980.80 (26.38%) |
834.95 |
762.05 - 1000.00 |
0.2484 times |
Fri 28 November 2025 |
776.05 (-11.41%) |
871.00 |
732.95 - 1022.00 |
0.1198 times |
Fri 31 October 2025 |
876.00 (6.78%) |
816.10 |
753.00 - 945.20 |
0.1521 times |
Tue 30 September 2025 |
820.40 (13.31%) |
714.00 |
690.00 - 874.80 |
8.3077 times |
Fri 29 August 2025 |
724.00 (-4.74%) |
740.00 |
710.00 - 763.50 |
0.3135 times |
Thu 31 July 2025 |
760.00 (-5%) |
800.00 |
740.05 - 819.80 |
0.1347 times |
Mon 30 June 2025 |
800.00 (-4.76%) |
790.05 |
780.00 - 880.00 |
0.0955 times |
Fri 30 May 2025 |
840.00 (0.17%) |
838.55 |
745.00 - 889.70 |
0.0772 times |
Wed 30 April 2025 |
838.55 (17.82%) |
717.00 |
701.30 - 999.95 |
0.4204 times |
Wed 26 March 2025 |
711.75 (-1.15%) |
715.00 |
700.05 - 765.00 |
0.1308 times |
Fri 28 February 2025 |
720.00 (-10.54%) |
800.00 |
682.00 - 892.20 |
0.15 times |

DMA SMA EMA moving averages of Eldeco Hous 523329
DMA (daily moving average) of Eldeco Hous 523329
| DMA period | DMA value | | 5 day DMA | 862.79 | | 12 day DMA | 832.1 | | 20 day DMA | 851.58 | | 35 day DMA | 851.97 | | 50 day DMA | 836.35 | | 100 day DMA | 799.8 | | 150 day DMA | 794.93 | | 200 day DMA | 798.77 | EMA (exponential moving average) of Eldeco Hous 523329
| EMA period | EMA current | EMA prev | EMA prev2 | | 5 day EMA | 893.02 | 849.13 | 801.77 | | 12 day EMA | 857.94 | 835.61 | 815.94 | | 20 day EMA | 851.48 | 837.87 | 826.72 | | 35 day EMA | 840.84 | 832.6 | 826.05 | | 50 day EMA | 835.89 | 829.98 | 825.33 |
SMA (simple moving average) of Eldeco Hous 523329
| SMA period | SMA current | SMA prev | SMA prev2 | | 5 day SMA | 862.79 | 826.16 | 796.92 | | 12 day SMA | 832.1 | 822.2 | 815.14 | | 20 day SMA | 851.58 | 847.26 | 843.87 | | 35 day SMA | 851.97 | 847.2 | 843.09 | | 50 day SMA | 836.35 | 832.84 | 829.88 | | 100 day SMA | 799.8 | 797.92 | 796.36 | | 150 day SMA | 794.93 | 793.18 | 791.69 | | 200 day SMA | 798.77 | 798.54 | 798.56 |
|
|
