JjFinance 523062 full analysis,charts,indicators,moving averages,SMA,DMA,EMA,ADX,MACD,RSIJj Finance 523062 WideScreen charts, DMA,SMA,EMA technical analysis, forecast prediction, by indicators ADX,MACD,RSI,CCI BSE stock exchange
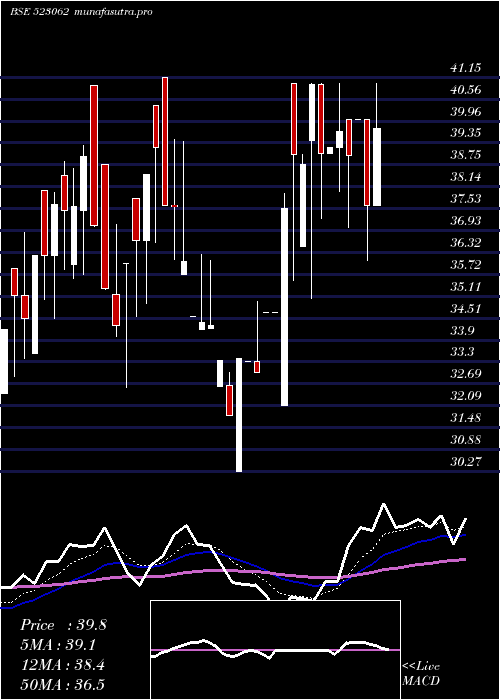
Daily price and charts and targets JjFinance Strong Daily Stock price targets for JjFinance 523062 are 38.69 and 42.07 | Daily Target 1 | 36.07 | | Daily Target 2 | 37.92 | | Daily Target 3 | 39.453333333333 | | Daily Target 4 | 41.3 | | Daily Target 5 | 42.83 |
Daily price and volume Jj Finance
| Date |
Closing |
Open |
Range |
Volume |
Thu 23 October 2025 |
39.76 (5.72%) |
37.61 |
37.61 - 40.99 |
5.3262 times |
Tue 21 October 2025 |
37.61 (-5.98%) |
40.00 |
36.11 - 40.00 |
0.0178 times |
Mon 20 October 2025 |
40.00 (2.56%) |
40.00 |
40.00 - 40.00 |
0.0166 times |
Fri 17 October 2025 |
39.00 (-1.69%) |
40.00 |
37.01 - 40.00 |
1.2256 times |
Thu 16 October 2025 |
39.67 (1.17%) |
39.21 |
38.00 - 40.99 |
0.9793 times |
Wed 15 October 2025 |
39.21 (0.41%) |
39.05 |
39.05 - 39.21 |
0.5873 times |
Tue 14 October 2025 |
39.05 (-4.71%) |
40.98 |
37.25 - 41.00 |
0.9828 times |
Mon 13 October 2025 |
40.98 (5.75%) |
39.41 |
35.06 - 41.00 |
0.251 times |
Fri 10 October 2025 |
38.75 (-0.69%) |
36.50 |
36.50 - 39.02 |
0.0332 times |
Thu 09 October 2025 |
39.02 (3.94%) |
41.00 |
35.55 - 41.00 |
0.5802 times |
Wed 08 October 2025 |
37.54 (8.31%) |
32.10 |
32.10 - 37.95 |
1.6152 times |
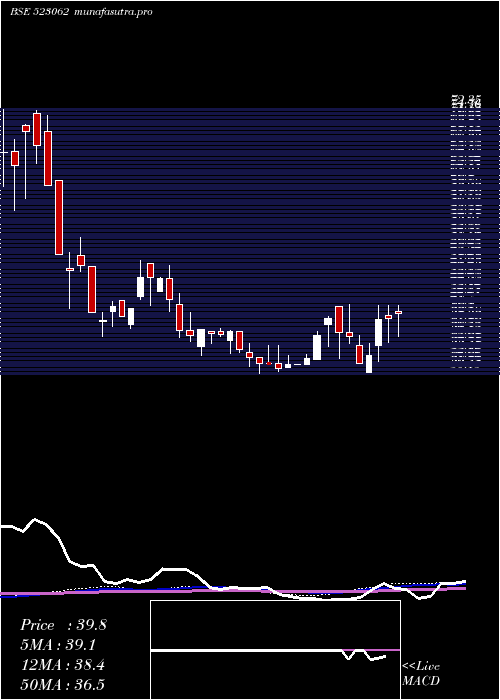
Weekly price and charts JjFinance Strong weekly Stock price targets for JjFinance 523062 are 35.5 and 40.38 | Weekly Target 1 | 34.07 | | Weekly Target 2 | 36.92 | | Weekly Target 3 | 38.953333333333 | | Weekly Target 4 | 41.8 | | Weekly Target 5 | 43.83 |
Weekly price and volumes for Jj Finance
| Date |
Closing |
Open |
Range |
Volume |
Thu 23 October 2025 |
39.76 (1.95%) |
40.00 |
36.11 - 40.99 |
0.519 times |
Fri 17 October 2025 |
39.00 (0.65%) |
39.41 |
35.06 - 41.00 |
0.3898 times |
Fri 10 October 2025 |
38.75 (17.39%) |
34.66 |
32.10 - 41.00 |
0.216 times |
Fri 03 October 2025 |
33.01 (3.81%) |
30.27 |
30.27 - 34.97 |
0.0408 times |
Fri 26 September 2025 |
31.80 (-11.84%) |
34.55 |
31.80 - 36.27 |
0.4415 times |
Fri 19 September 2025 |
36.07 (-1.56%) |
36.64 |
34.92 - 41.15 |
0.3895 times |
Fri 12 September 2025 |
36.64 (-6.03%) |
40.93 |
32.60 - 40.93 |
4.2909 times |
Fri 05 September 2025 |
38.99 (7.62%) |
38.04 |
34.50 - 39.27 |
1.2871 times |
Fri 29 August 2025 |
36.23 (11.24%) |
32.41 |
32.41 - 36.88 |
2.0732 times |
Fri 22 August 2025 |
32.57 (3.23%) |
31.55 |
31.50 - 33.12 |
0.3521 times |
Mon 11 August 2025 |
31.55 (0.13%) |
31.52 |
31.52 - 31.56 |
0.0092 times |
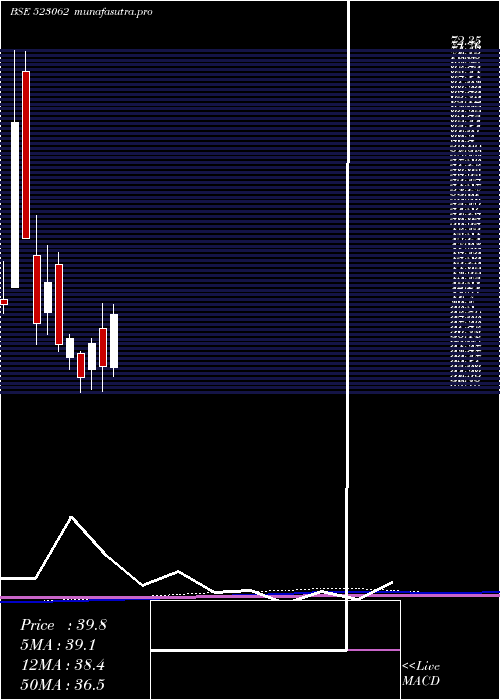
Monthly price and charts JjFinance Strong monthly Stock price targets for JjFinance 523062 are 35.93 and 44.83 | Monthly Target 1 | 28.72 | | Monthly Target 2 | 34.24 | | Monthly Target 3 | 37.62 | | Monthly Target 4 | 43.14 | | Monthly Target 5 | 46.52 |
Monthly price and volumes Jj Finance
| Date |
Closing |
Open |
Range |
Volume |
Thu 23 October 2025 |
39.76 (19.08%) |
33.31 |
32.10 - 41.00 |
0.1087 times |
Mon 29 September 2025 |
33.39 (-7.84%) |
38.04 |
30.27 - 41.15 |
0.6124 times |
Fri 29 August 2025 |
36.23 (13.08%) |
33.00 |
30.60 - 36.88 |
0.2424 times |
Thu 31 July 2025 |
32.04 (-12.98%) |
35.00 |
30.15 - 35.20 |
0.1611 times |
Mon 30 June 2025 |
36.82 (1.83%) |
34.52 |
33.00 - 37.37 |
0.1189 times |
Fri 30 May 2025 |
36.16 (-17.37%) |
45.90 |
35.20 - 47.50 |
0.2469 times |
Wed 30 April 2025 |
43.76 (13.1%) |
39.99 |
37.38 - 48.25 |
0.099 times |
Fri 28 March 2025 |
38.69 (-21.22%) |
47.02 |
36.09 - 51.95 |
2.1448 times |
Fri 28 February 2025 |
49.11 (-22.61%) |
69.80 |
49.11 - 72.25 |
3.1798 times |
Fri 31 January 2025 |
63.46 (54.71%) |
43.07 |
43.07 - 72.35 |
3.086 times |
Tue 31 December 2024 |
41.02 (2.42%) |
39.25 |
37.71 - 46.33 |
0.2677 times |
DMA SMA EMA moving averages of Jj Finance 523062
DMA (daily moving average) of Jj Finance 523062
| DMA period | DMA value | | 5 day DMA | 39.21 | | 12 day DMA | 38.77 | | 20 day DMA | 36.67 | | 35 day DMA | 36.8 | | 50 day DMA | 35.66 | | 100 day DMA | 35.26 | | 150 day DMA | 38.15 | | 200 day DMA | 42.73 | EMA (exponential moving average) of Jj Finance 523062
| EMA period | EMA current | EMA prev | EMA prev2 | | 5 day EMA | 39.12 | 38.8 | 39.39 | | 12 day EMA | 38.41 | 38.17 | 38.27 | | 20 day EMA | 37.66 | 37.44 | 37.42 | | 35 day EMA | 36.52 | 36.33 | 36.25 | | 50 day EMA | 35.71 | 35.54 | 35.46 |
SMA (simple moving average) of Jj Finance 523062
| SMA period | SMA current | SMA prev | SMA prev2 | | 5 day SMA | 39.21 | 39.1 | 39.39 | | 12 day SMA | 38.77 | 38.35 | 37.96 | | 20 day SMA | 36.67 | 36.41 | 36.34 | | 35 day SMA | 36.8 | 36.7 | 36.66 | | 50 day SMA | 35.66 | 35.49 | 35.38 | | 100 day SMA | 35.26 | 35.24 | 35.27 | | 150 day SMA | 38.15 | 38.31 | 38.5 | | 200 day SMA | 42.73 | 42.74 | 42.75 |
|
|
