SinclairHot 523023 full analysis,charts,indicators,moving averages,SMA,DMA,EMA,ADX,MACD,RSISinclair Hot 523023 WideScreen charts, DMA,SMA,EMA technical analysis, forecast prediction, by indicators ADX,MACD,RSI,CCI BSE stock exchange
Daily price and charts and targets SinclairHot Strong Daily Stock price targets for SinclairHot 523023 are 95.38 and 96.75 | Daily Target 1 | 95.04 | | Daily Target 2 | 95.72 | | Daily Target 3 | 96.41 | | Daily Target 4 | 97.09 | | Daily Target 5 | 97.78 |
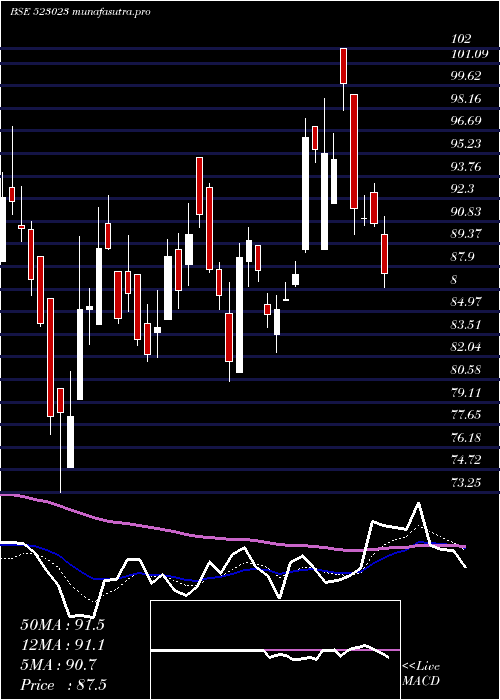
Daily price and volume Sinclair Hot
| Date |
Closing |
Open |
Range |
Volume |
Thu 23 October 2025 |
96.40 (-0.84%) |
97.10 |
95.73 - 97.10 |
0.8958 times |
Tue 21 October 2025 |
97.22 (1.34%) |
97.68 |
95.83 - 97.68 |
0.2033 times |
Mon 20 October 2025 |
95.93 (1.73%) |
94.70 |
94.35 - 96.50 |
0.5056 times |
Fri 17 October 2025 |
94.30 (-0.43%) |
95.21 |
93.46 - 95.86 |
2.0959 times |
Thu 16 October 2025 |
94.71 (-1.29%) |
91.65 |
91.65 - 96.95 |
0.7977 times |
Wed 15 October 2025 |
95.95 (1.06%) |
94.99 |
94.69 - 96.15 |
0.3388 times |
Tue 14 October 2025 |
94.94 (-1.31%) |
96.35 |
94.88 - 96.85 |
0.3586 times |
Mon 13 October 2025 |
96.20 (-1.56%) |
97.99 |
93.79 - 98.00 |
1.9926 times |
Fri 10 October 2025 |
97.72 (0.38%) |
97.80 |
96.90 - 98.79 |
2.5707 times |
Thu 09 October 2025 |
97.35 (-1.11%) |
98.88 |
95.73 - 99.30 |
0.2411 times |
Wed 08 October 2025 |
98.44 (-0.56%) |
99.09 |
98.40 - 99.87 |
1.2127 times |
Weekly price and charts SinclairHot Strong weekly Stock price targets for SinclairHot 523023 are 95.38 and 98.71 | Weekly Target 1 | 92.81 | | Weekly Target 2 | 94.61 | | Weekly Target 3 | 96.143333333333 | | Weekly Target 4 | 97.94 | | Weekly Target 5 | 99.47 |
Weekly price and volumes for Sinclair Hot
| Date |
Closing |
Open |
Range |
Volume |
Thu 23 October 2025 |
96.40 (2.23%) |
94.70 |
94.35 - 97.68 |
0.1651 times |
Fri 17 October 2025 |
94.30 (-3.5%) |
97.99 |
91.65 - 98.00 |
0.5746 times |
Fri 10 October 2025 |
97.72 (-1.36%) |
99.07 |
95.73 - 101.04 |
0.5756 times |
Fri 03 October 2025 |
99.07 (1.83%) |
96.69 |
96.14 - 100.20 |
0.7547 times |
Fri 26 September 2025 |
97.29 (-9.44%) |
108.43 |
96.55 - 110.44 |
1.6988 times |
Fri 19 September 2025 |
107.43 (-3.62%) |
108.55 |
102.86 - 114.00 |
2.019 times |
Fri 12 September 2025 |
111.47 (3.12%) |
109.18 |
106.51 - 114.80 |
1.4466 times |
Fri 05 September 2025 |
108.10 (9.47%) |
98.75 |
96.51 - 109.41 |
1.4076 times |
Fri 29 August 2025 |
98.75 (0.92%) |
96.35 |
95.70 - 101.55 |
0.7489 times |
Fri 22 August 2025 |
97.85 (-2.35%) |
104.95 |
96.30 - 104.95 |
0.6091 times |
Thu 14 August 2025 |
100.20 (2.51%) |
97.10 |
95.90 - 103.95 |
0.3627 times |

Monthly price and charts SinclairHot Strong monthly Stock price targets for SinclairHot 523023 are 89.33 and 98.72 | Monthly Target 1 | 86.97 | | Monthly Target 2 | 91.69 | | Monthly Target 3 | 96.363333333333 | | Monthly Target 4 | 101.08 | | Monthly Target 5 | 105.75 |
Monthly price and volumes Sinclair Hot
| Date |
Closing |
Open |
Range |
Volume |
Thu 23 October 2025 |
96.40 (-3.06%) |
99.57 |
91.65 - 101.04 |
0.3012 times |
Tue 30 September 2025 |
99.44 (0.7%) |
98.75 |
96.14 - 114.80 |
1.4617 times |
Fri 29 August 2025 |
98.75 (-4.53%) |
102.50 |
95.10 - 104.95 |
0.5071 times |
Thu 31 July 2025 |
103.44 (12.14%) |
92.96 |
91.05 - 113.13 |
1.6516 times |
Mon 30 June 2025 |
92.24 (-0.67%) |
92.54 |
86.38 - 98.00 |
0.4074 times |
Fri 30 May 2025 |
92.86 (6.16%) |
88.79 |
82.11 - 97.70 |
0.5439 times |
Wed 30 April 2025 |
87.47 (6.98%) |
81.00 |
81.00 - 102.00 |
0.6895 times |
Fri 28 March 2025 |
81.76 (4.59%) |
79.99 |
73.25 - 94.99 |
1.2362 times |
Fri 28 February 2025 |
78.17 (-16.66%) |
107.90 |
77.00 - 107.90 |
0.9553 times |
Fri 31 January 2025 |
93.80 (-23.65%) |
123.00 |
89.75 - 139.00 |
2.246 times |
Tue 31 December 2024 |
122.85 (15.57%) |
111.05 |
104.20 - 133.05 |
2.1088 times |

DMA SMA EMA moving averages of Sinclair Hot 523023
DMA (daily moving average) of Sinclair Hot 523023
| DMA period | DMA value | | 5 day DMA | 95.71 | | 12 day DMA | 96.51 | | 20 day DMA | 97.31 | | 35 day DMA | 101.86 | | 50 day DMA | 100.85 | | 100 day DMA | 98.25 | | 150 day DMA | 95.34 | | 200 day DMA | 96.95 | EMA (exponential moving average) of Sinclair Hot 523023
| EMA period | EMA current | EMA prev | EMA prev2 | | 5 day EMA | 96.19 | 96.09 | 95.53 | | 12 day EMA | 96.79 | 96.86 | 96.79 | | 20 day EMA | 97.91 | 98.07 | 98.16 | | 35 day EMA | 98.74 | 98.88 | 98.98 | | 50 day EMA | 100.18 | 100.33 | 100.46 |
SMA (simple moving average) of Sinclair Hot 523023
| SMA period | SMA current | SMA prev | SMA prev2 | | 5 day SMA | 95.71 | 95.62 | 95.17 | | 12 day SMA | 96.51 | 96.75 | 96.91 | | 20 day SMA | 97.31 | 97.62 | 98.08 | | 35 day SMA | 101.86 | 101.93 | 101.93 | | 50 day SMA | 100.85 | 100.88 | 100.87 | | 100 day SMA | 98.25 | 98.21 | 98.16 | | 150 day SMA | 95.34 | 95.26 | 95.18 | | 200 day SMA | 96.95 | 97.09 | 97.24 |
|
|
