TI 522294 full analysis,charts,indicators,moving averages,SMA,DMA,EMA,ADX,MACD,RSIT I 522294 WideScreen charts, DMA,SMA,EMA technical analysis, forecast prediction, by indicators ADX,MACD,RSI,CCI BSE stock exchange
Daily price and charts and targets TI Strong Daily Stock price targets for TI 522294 are 193.43 and 199.58 | Daily Target 1 | 189.3 | | Daily Target 2 | 191.4 | | Daily Target 3 | 195.45 | | Daily Target 4 | 197.55 | | Daily Target 5 | 201.6 |
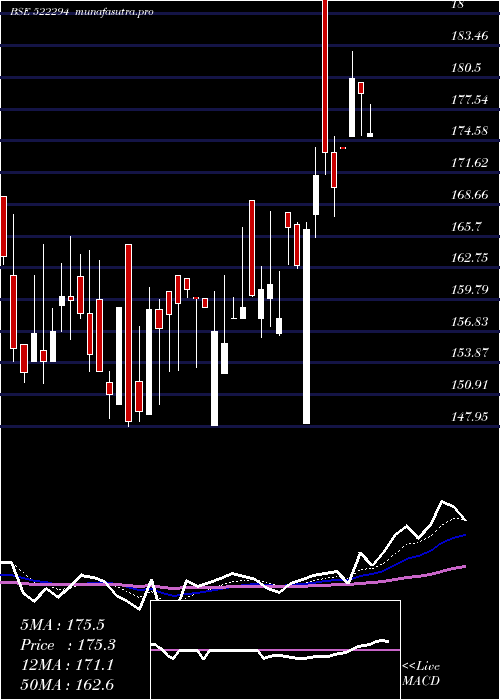
Daily price and volume T I
| Date |
Closing |
Open |
Range |
Volume |
Tue 21 October 2025 |
193.50 (0.08%) |
193.35 |
193.35 - 199.50 |
1.8748 times |
Mon 20 October 2025 |
193.35 (0.03%) |
193.25 |
193.25 - 197.90 |
0.3654 times |
Fri 17 October 2025 |
193.30 (1.2%) |
191.00 |
186.20 - 195.70 |
0.8522 times |
Thu 16 October 2025 |
191.00 (-1.52%) |
193.85 |
187.70 - 197.40 |
0.486 times |
Wed 15 October 2025 |
193.95 (2.46%) |
185.00 |
177.35 - 194.85 |
0.7689 times |
Tue 14 October 2025 |
189.30 (-0.39%) |
190.05 |
187.00 - 192.00 |
1.2188 times |
Mon 13 October 2025 |
190.05 (-2.29%) |
183.15 |
183.15 - 195.00 |
2.3 times |
Fri 10 October 2025 |
194.50 (-1.17%) |
196.80 |
188.00 - 199.95 |
0.6963 times |
Thu 09 October 2025 |
196.80 (3.47%) |
186.40 |
186.40 - 199.00 |
0.6585 times |
Wed 08 October 2025 |
190.20 (-3.48%) |
201.00 |
187.00 - 201.00 |
0.7791 times |
Tue 07 October 2025 |
197.05 (1.6%) |
197.30 |
185.05 - 198.90 |
2.9003 times |
Weekly price and charts TI Strong weekly Stock price targets for TI 522294 are 193.38 and 199.63 | Weekly Target 1 | 189.17 | | Weekly Target 2 | 191.33 | | Weekly Target 3 | 195.41666666667 | | Weekly Target 4 | 197.58 | | Weekly Target 5 | 201.67 |
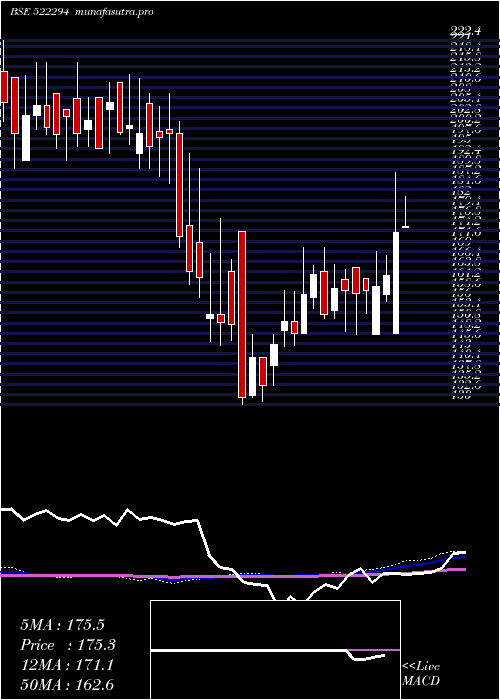
Weekly price and volumes for T I
| Date |
Closing |
Open |
Range |
Volume |
Tue 21 October 2025 |
193.50 (0.1%) |
193.25 |
193.25 - 199.50 |
0.5058 times |
Fri 17 October 2025 |
193.30 (-0.62%) |
183.15 |
177.35 - 197.40 |
1.2704 times |
Fri 10 October 2025 |
194.50 (7.61%) |
197.70 |
181.35 - 201.00 |
1.4493 times |
Fri 03 October 2025 |
180.75 (-4.92%) |
198.90 |
174.00 - 199.85 |
2.0083 times |
Fri 26 September 2025 |
190.10 (-0.05%) |
198.35 |
181.10 - 199.00 |
1.0322 times |
Fri 19 September 2025 |
190.20 (1.14%) |
193.90 |
182.15 - 199.90 |
1.331 times |
Fri 12 September 2025 |
188.05 (3.49%) |
176.00 |
176.00 - 192.80 |
0.3141 times |
Fri 05 September 2025 |
181.70 (4.04%) |
174.00 |
174.00 - 191.00 |
0.6302 times |
Fri 29 August 2025 |
174.65 (-1.41%) |
173.00 |
171.35 - 190.00 |
0.3033 times |
Fri 22 August 2025 |
177.15 (1.61%) |
174.45 |
171.25 - 184.90 |
1.1553 times |
Thu 14 August 2025 |
174.35 (-0.37%) |
189.40 |
163.20 - 210.40 |
8.0346 times |
Monthly price and charts TI Strong monthly Stock price targets for TI 522294 are 184.75 and 209.75 | Monthly Target 1 | 165.17 | | Monthly Target 2 | 179.33 | | Monthly Target 3 | 190.16666666667 | | Monthly Target 4 | 204.33 | | Monthly Target 5 | 215.17 |
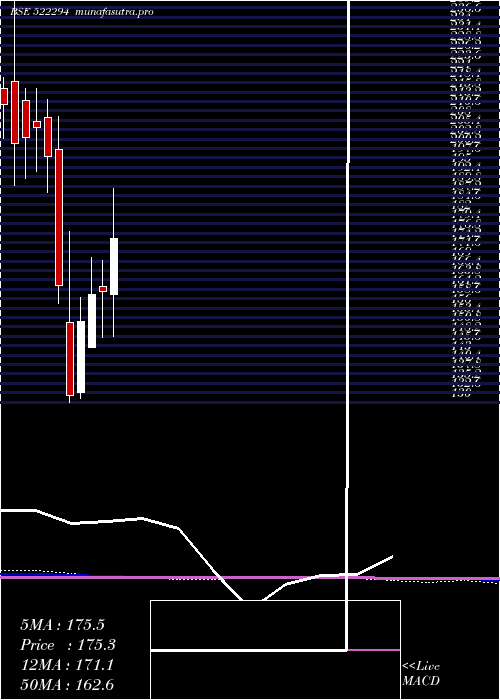
Monthly price and volumes T I
| Date |
Closing |
Open |
Range |
Volume |
Tue 21 October 2025 |
193.50 (10.45%) |
176.20 |
176.00 - 201.00 |
0.6457 times |
Tue 30 September 2025 |
175.20 (0.31%) |
174.00 |
174.00 - 199.90 |
0.8703 times |
Fri 29 August 2025 |
174.65 (-0.03%) |
180.00 |
163.20 - 210.40 |
1.7362 times |
Thu 31 July 2025 |
174.70 (8.71%) |
159.90 |
148.25 - 189.00 |
0.4544 times |
Mon 30 June 2025 |
160.70 (0.66%) |
161.95 |
147.95 - 169.05 |
1.8811 times |
Fri 30 May 2025 |
159.65 (4.76%) |
145.05 |
145.05 - 170.00 |
1.268 times |
Wed 30 April 2025 |
152.40 (15.63%) |
132.50 |
131.00 - 159.00 |
1.0029 times |
Fri 28 March 2025 |
131.80 (-18.84%) |
151.90 |
130.00 - 177.35 |
1.1607 times |
Fri 28 February 2025 |
162.40 (-17.96%) |
200.00 |
157.20 - 209.00 |
0.4833 times |
Fri 31 January 2025 |
197.95 (-3.88%) |
208.90 |
188.05 - 213.90 |
0.4975 times |
Tue 31 December 2024 |
205.95 (1.33%) |
207.80 |
193.80 - 216.90 |
1.3765 times |
DMA SMA EMA moving averages of T I 522294
DMA (daily moving average) of T I 522294
| DMA period | DMA value | | 5 day DMA | 193.02 | | 12 day DMA | 193.08 | | 20 day DMA | 189.61 | | 35 day DMA | 187.76 | | 50 day DMA | 185.07 | | 100 day DMA | 174.47 | | 150 day DMA | 166.58 | | 200 day DMA | 172.39 | EMA (exponential moving average) of T I 522294
| EMA period | EMA current | EMA prev | EMA prev2 | | 5 day EMA | 192.9 | 192.6 | 192.23 | | 12 day EMA | 191.69 | 191.36 | 191 | | 20 day EMA | 190.25 | 189.91 | 189.55 | | 35 day EMA | 187.34 | 186.98 | 186.6 | | 50 day EMA | 184.75 | 184.39 | 184.02 |
SMA (simple moving average) of T I 522294
| SMA period | SMA current | SMA prev | SMA prev2 | | 5 day SMA | 193.02 | 192.18 | 191.52 | | 12 day SMA | 193.08 | 192.02 | 191.18 | | 20 day SMA | 189.61 | 189.14 | 188.98 | | 35 day SMA | 187.76 | 187.24 | 186.71 | | 50 day SMA | 185.07 | 184.64 | 184.18 | | 100 day SMA | 174.47 | 174.11 | 173.71 | | 150 day SMA | 166.58 | 166.3 | 166.02 | | 200 day SMA | 172.39 | 172.4 | 172.44 |
|
|
