CenlubIndus 522251 full analysis,charts,indicators,moving averages,SMA,DMA,EMA,ADX,MACD,RSICenlub Indus 522251 WideScreen charts, DMA,SMA,EMA technical analysis, forecast prediction, by indicators ADX,MACD,RSI,CCI BSE stock exchange
Daily price and charts and targets CenlubIndus Strong Daily Stock price targets for CenlubIndus 522251 are 333.08 and 349.88 | Daily Target 1 | 329.12 | | Daily Target 2 | 337.03 | | Daily Target 3 | 345.91666666667 | | Daily Target 4 | 353.83 | | Daily Target 5 | 362.72 |
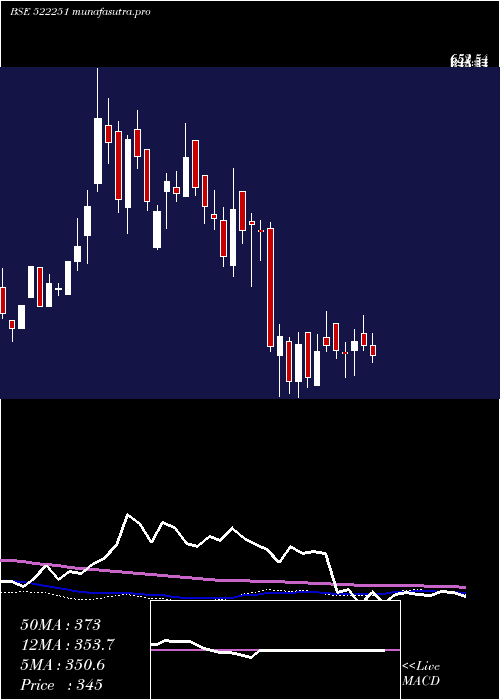
Daily price and volume Cenlub Indus
| Date |
Closing |
Open |
Range |
Volume |
| Wed 30 April 2025 |
344.95 (0.2%) |
354.80 |
338.00 - 354.80 |
0.8546 times |
| Tue 29 April 2025 |
344.25 (-1.39%) |
368.95 |
341.10 - 368.95 |
0.4879 times |
| Mon 28 April 2025 |
349.10 (-1.92%) |
356.00 |
345.00 - 363.00 |
0.39 times |
| Fri 25 April 2025 |
355.95 (-4.17%) |
369.60 |
350.10 - 377.00 |
0.8144 times |
| Thu 24 April 2025 |
371.45 (1.3%) |
368.00 |
368.00 - 383.00 |
0.6126 times |
| Tue 22 April 2025 |
366.70 (-3.02%) |
388.00 |
361.00 - 388.00 |
2.0159 times |
| Mon 21 April 2025 |
378.10 (5.07%) |
368.95 |
358.00 - 385.00 |
2.1138 times |
| Thu 17 April 2025 |
359.85 (3.15%) |
364.95 |
330.00 - 370.00 |
1.0415 times |
| Wed 16 April 2025 |
348.85 (-0.71%) |
372.90 |
323.50 - 372.90 |
0.8818 times |
| Tue 15 April 2025 |
351.35 (1.17%) |
351.00 |
340.50 - 369.00 |
0.7874 times |
| Fri 11 April 2025 |
347.30 (3.75%) |
349.95 |
341.05 - 356.00 |
0.5555 times |

Weekly price and charts CenlubIndus Strong weekly Stock price targets for CenlubIndus 522251 are 326 and 356.95 | Weekly Target 1 | 319.68 | | Weekly Target 2 | 332.32 | | Weekly Target 3 | 350.63333333333 | | Weekly Target 4 | 363.27 | | Weekly Target 5 | 381.58 |
Weekly price and volumes for Cenlub Indus
| Date |
Closing |
Open |
Range |
Volume |
| Wed 30 April 2025 |
344.95 (-3.09%) |
356.00 |
338.00 - 368.95 |
0.4429 times |
| Fri 25 April 2025 |
355.95 (-1.08%) |
368.95 |
350.10 - 388.00 |
1.4205 times |
| Thu 17 April 2025 |
359.85 (3.61%) |
351.00 |
323.50 - 372.90 |
0.6929 times |
| Fri 11 April 2025 |
347.30 (-0.91%) |
348.00 |
322.00 - 359.00 |
0.3573 times |
| Fri 04 April 2025 |
350.50 (-1.6%) |
379.95 |
341.65 - 380.00 |
0.513 times |
| Fri 28 March 2025 |
356.20 (1.92%) |
364.00 |
350.05 - 391.95 |
2.6413 times |
| Fri 21 March 2025 |
349.50 (8.69%) |
313.50 |
313.00 - 367.95 |
0.986 times |
| Thu 13 March 2025 |
321.55 (-9.82%) |
369.90 |
311.20 - 369.90 |
1.1276 times |
| Fri 07 March 2025 |
356.55 (12.35%) |
318.00 |
300.25 - 369.50 |
1.0865 times |
| Fri 28 February 2025 |
317.35 (-13.26%) |
360.00 |
305.05 - 364.90 |
0.732 times |
| Fri 21 February 2025 |
365.85 (2.94%) |
345.50 |
301.20 - 378.00 |
2.0267 times |
Monthly price and charts CenlubIndus Strong monthly Stock price targets for CenlubIndus 522251 are 300.48 and 366.48 | Monthly Target 1 | 285.65 | | Monthly Target 2 | 315.3 | | Monthly Target 3 | 351.65 | | Monthly Target 4 | 381.3 | | Monthly Target 5 | 417.65 |
Monthly price and volumes Cenlub Indus
| Date |
Closing |
Open |
Range |
Volume |
| Wed 30 April 2025 |
344.95 (-3.16%) |
379.95 |
322.00 - 388.00 |
0.4201 times |
| Fri 28 March 2025 |
356.20 (12.24%) |
318.00 |
300.25 - 391.95 |
0.7162 times |
| Fri 28 February 2025 |
317.35 (-34.57%) |
479.00 |
301.20 - 490.00 |
0.6535 times |
| Fri 31 January 2025 |
485.00 (-2.34%) |
490.10 |
419.50 - 544.90 |
0.6983 times |
| Tue 31 December 2024 |
496.60 (-6.53%) |
525.05 |
480.00 - 592.90 |
0.8761 times |
| Fri 29 November 2024 |
531.30 (-3.24%) |
552.05 |
458.55 - 606.95 |
1.3085 times |
| Thu 31 October 2024 |
549.10 (16.09%) |
489.95 |
475.30 - 652.00 |
2.6812 times |
| Mon 30 September 2024 |
473.00 (18.87%) |
397.90 |
397.90 - 491.60 |
0.9943 times |
| Fri 30 August 2024 |
397.90 (0.18%) |
397.20 |
360.20 - 440.35 |
0.5113 times |
| Wed 31 July 2024 |
397.20 (-1.44%) |
394.95 |
343.55 - 438.00 |
1.1404 times |
| Fri 28 June 2024 |
403.00 (13.89%) |
370.95 |
307.70 - 406.85 |
0.7342 times |

DMA SMA EMA moving averages of Cenlub Indus 522251
DMA (daily moving average) of Cenlub Indus 522251
| DMA period | DMA value | | 5 day DMA | 353.14 | | 12 day DMA | 354.38 | | 20 day DMA | 357.36 | | 35 day DMA | 348.12 | | 50 day DMA | 359.9 | | 100 day DMA | 430.22 | | 150 day DMA | 459.21 | | 200 day DMA | 442.62 | EMA (exponential moving average) of Cenlub Indus 522251
| EMA period | EMA current | EMA prev | EMA prev2 | | 5 day EMA | 350.58 | 353.4 | 357.98 | | 12 day EMA | 353.7 | 355.29 | 357.3 | | 20 day EMA | 354.85 | 355.89 | 357.12 | | 35 day EMA | 362.72 | 363.77 | 364.92 | | 50 day EMA | 368.06 | 369 | 370.01 |
SMA (simple moving average) of Cenlub Indus 522251
| SMA period | SMA current | SMA prev | SMA prev2 | | 5 day SMA | 353.14 | 357.49 | 364.26 | | 12 day SMA | 354.38 | 353.8 | 354.32 | | 20 day SMA | 357.36 | 357.59 | 357.33 | | 35 day SMA | 348.12 | 347.81 | 347.98 | | 50 day SMA | 359.9 | 362.47 | 364.8 | | 100 day SMA | 430.22 | 431.69 | 433.21 | | 150 day SMA | 459.21 | 459.68 | 460.16 | | 200 day SMA | 442.62 | 442.89 | 443.18 |
|
|
