KilburnEngg 522101 full analysis,charts,indicators,moving averages,SMA,DMA,EMA,ADX,MACD,RSIKilburn Engg 522101 WideScreen charts, DMA,SMA,EMA technical analysis, forecast prediction, by indicators ADX,MACD,RSI,CCI BSE stock exchange
Daily price and charts and targets KilburnEngg Strong Daily Stock price targets for KilburnEngg 522101 are 554.95 and 565.95 | Daily Target 1 | 552.97 | | Daily Target 2 | 556.93 | | Daily Target 3 | 563.96666666667 | | Daily Target 4 | 567.93 | | Daily Target 5 | 574.97 |
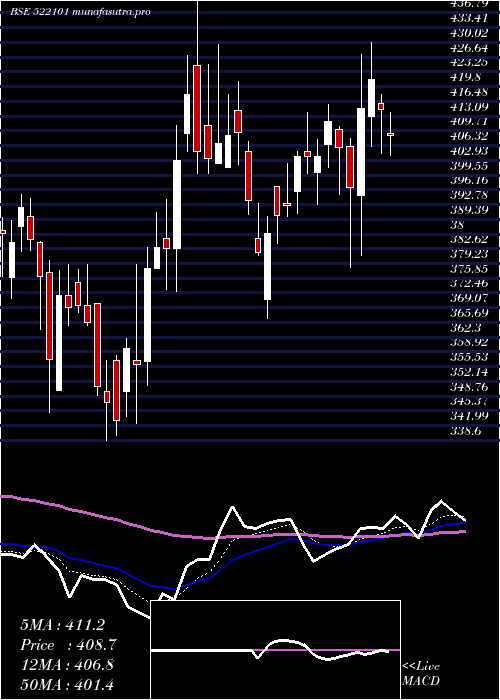
Daily price and volume Kilburn Engg
| Date |
Closing |
Open |
Range |
Volume |
Thu 23 October 2025 |
560.90 (-0.83%) |
565.00 |
560.00 - 571.00 |
0.3215 times |
Tue 21 October 2025 |
565.60 (0.73%) |
562.30 |
560.30 - 571.00 |
0.2262 times |
Mon 20 October 2025 |
561.50 (1.11%) |
557.90 |
550.25 - 568.90 |
0.9454 times |
Fri 17 October 2025 |
555.35 (0.7%) |
550.00 |
550.00 - 557.90 |
0.6032 times |
Thu 16 October 2025 |
551.50 (-0.47%) |
553.95 |
545.05 - 560.15 |
0.6451 times |
Wed 15 October 2025 |
554.10 (2.62%) |
544.00 |
532.75 - 560.00 |
0.4824 times |
Tue 14 October 2025 |
539.95 (-3.36%) |
562.00 |
528.00 - 562.00 |
1.9052 times |
Mon 13 October 2025 |
558.70 (0.12%) |
558.00 |
547.50 - 568.00 |
0.3155 times |
Fri 10 October 2025 |
558.05 (-1.55%) |
567.15 |
542.55 - 571.00 |
3.7864 times |
Thu 09 October 2025 |
566.85 (0.35%) |
562.60 |
561.00 - 569.70 |
0.7691 times |
Wed 08 October 2025 |
564.90 (-0.19%) |
566.95 |
556.15 - 575.00 |
0.4777 times |
Weekly price and charts KilburnEngg Strong weekly Stock price targets for KilburnEngg 522101 are 555.58 and 576.33 | Weekly Target 1 | 539.97 | | Weekly Target 2 | 550.43 | | Weekly Target 3 | 560.71666666667 | | Weekly Target 4 | 571.18 | | Weekly Target 5 | 581.47 |
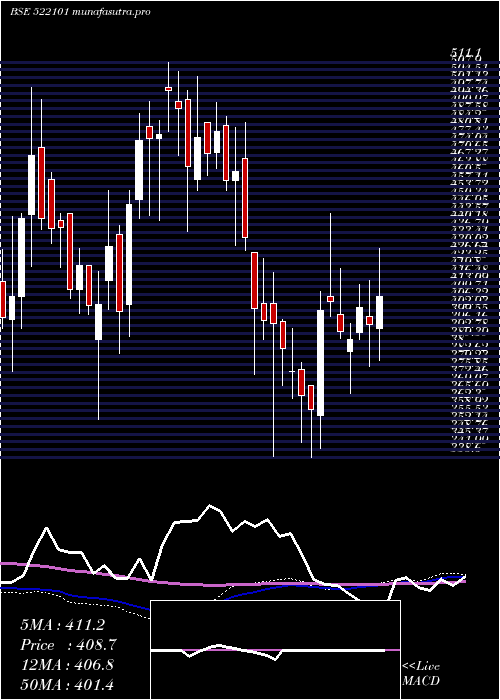
Weekly price and volumes for Kilburn Engg
| Date |
Closing |
Open |
Range |
Volume |
Thu 23 October 2025 |
560.90 (1%) |
557.90 |
550.25 - 571.00 |
0.1974 times |
Fri 17 October 2025 |
555.35 (-0.48%) |
558.00 |
528.00 - 568.00 |
0.5224 times |
Fri 10 October 2025 |
558.05 (-2.03%) |
572.40 |
539.95 - 575.00 |
0.7874 times |
Fri 03 October 2025 |
569.60 (1.74%) |
559.85 |
555.15 - 618.40 |
0.6521 times |
Fri 26 September 2025 |
559.85 (1.27%) |
553.65 |
543.95 - 571.70 |
1.1566 times |
Fri 19 September 2025 |
552.85 (2.38%) |
543.50 |
531.30 - 555.00 |
0.4336 times |
Fri 12 September 2025 |
540.00 (-0.92%) |
541.00 |
525.10 - 550.75 |
0.815 times |
Fri 05 September 2025 |
545.00 (-1.79%) |
558.00 |
521.60 - 560.00 |
0.9308 times |
Fri 29 August 2025 |
554.95 (-2.46%) |
572.00 |
544.85 - 572.00 |
1.306 times |
Fri 22 August 2025 |
568.95 (4.32%) |
550.00 |
537.95 - 572.90 |
3.1989 times |
Thu 14 August 2025 |
545.40 (2.55%) |
535.00 |
481.95 - 560.00 |
2.5213 times |
Monthly price and charts KilburnEngg Strong monthly Stock price targets for KilburnEngg 522101 are 508.45 and 580.45 | Monthly Target 1 | 490.97 | | Monthly Target 2 | 525.93 | | Monthly Target 3 | 562.96666666667 | | Monthly Target 4 | 597.93 | | Monthly Target 5 | 634.97 |
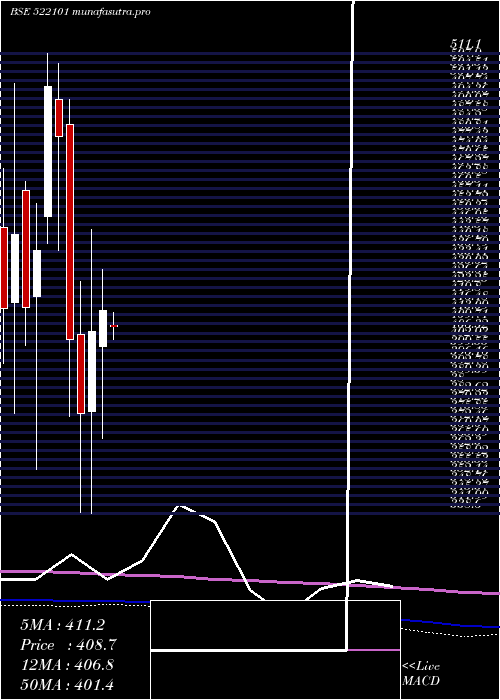
Monthly price and volumes Kilburn Engg
| Date |
Closing |
Open |
Range |
Volume |
Thu 23 October 2025 |
560.90 (-4.94%) |
592.00 |
528.00 - 600.00 |
0.2747 times |
Tue 30 September 2025 |
590.05 (6.32%) |
558.00 |
521.60 - 618.40 |
0.6122 times |
Fri 29 August 2025 |
554.95 (5.66%) |
525.25 |
481.95 - 572.90 |
1.5326 times |
Thu 31 July 2025 |
525.20 (18.65%) |
442.50 |
432.05 - 546.50 |
2.2107 times |
Mon 30 June 2025 |
442.65 (12.42%) |
394.00 |
390.10 - 458.00 |
1.486 times |
Fri 30 May 2025 |
393.75 (-5.04%) |
409.00 |
378.85 - 430.00 |
0.9669 times |
Wed 30 April 2025 |
414.65 (1.94%) |
401.20 |
366.60 - 430.00 |
1.019 times |
Fri 28 March 2025 |
406.75 (8.14%) |
377.05 |
338.60 - 445.00 |
0.8722 times |
Fri 28 February 2025 |
376.15 (-6.86%) |
405.85 |
339.00 - 425.55 |
0.4213 times |
Fri 31 January 2025 |
403.85 (-15.86%) |
484.60 |
375.00 - 493.85 |
0.6044 times |
Tue 31 December 2024 |
479.95 (-3.77%) |
494.00 |
437.15 - 507.40 |
0.7137 times |
DMA SMA EMA moving averages of Kilburn Engg 522101
DMA (daily moving average) of Kilburn Engg 522101
| DMA period | DMA value | | 5 day DMA | 558.97 | | 12 day DMA | 558.62 | | 20 day DMA | 562.87 | | 35 day DMA | 554.89 | | 50 day DMA | 554.25 | | 100 day DMA | 511.7 | | 150 day DMA | 473.09 | | 200 day DMA | 460.37 | EMA (exponential moving average) of Kilburn Engg 522101
| EMA period | EMA current | EMA prev | EMA prev2 | | 5 day EMA | 560.03 | 559.59 | 556.59 | | 12 day EMA | 559.31 | 559.02 | 557.82 | | 20 day EMA | 558.66 | 558.42 | 557.67 | | 35 day EMA | 556.9 | 556.66 | 556.13 | | 50 day EMA | 553.46 | 553.16 | 552.65 |
SMA (simple moving average) of Kilburn Engg 522101
| SMA period | SMA current | SMA prev | SMA prev2 | | 5 day SMA | 558.97 | 557.61 | 552.48 | | 12 day SMA | 558.62 | 558.62 | 558.95 | | 20 day SMA | 562.87 | 562.36 | 561.78 | | 35 day SMA | 554.89 | 554.54 | 554.12 | | 50 day SMA | 554.25 | 553.67 | 553.19 | | 100 day SMA | 511.7 | 510.04 | 508.32 | | 150 day SMA | 473.09 | 471.81 | 470.5 | | 200 day SMA | 460.37 | 459.9 | 459.41 |
|
|
