UvDer 522091 full analysis,charts,indicators,moving averages,SMA,DMA,EMA,ADX,MACD,RSIUv Der 522091 WideScreen charts, DMA,SMA,EMA technical analysis, forecast prediction, by indicators ADX,MACD,RSI,CCI BSE stock exchange
Daily price and charts and targets UvDer Strong Daily Stock price targets for UvDer 522091 are 150.63 and 157.53 | Daily Target 1 | 145.15 | | Daily Target 2 | 149.2 | | Daily Target 3 | 152.05 | | Daily Target 4 | 156.1 | | Daily Target 5 | 158.95 |
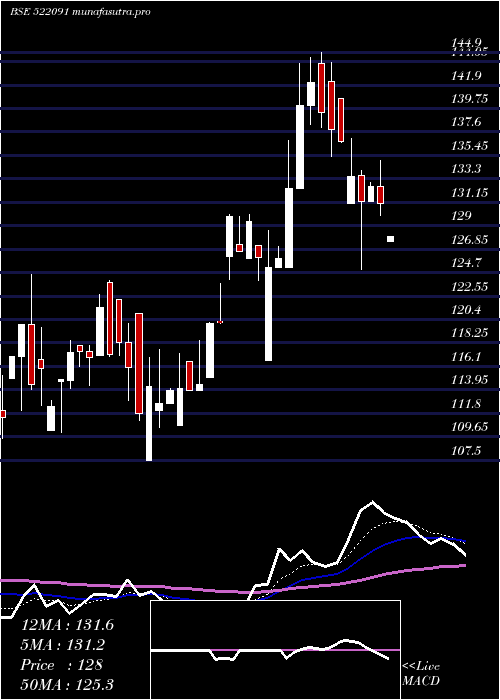
Daily price and volume Uv Der
| Date |
Closing |
Open |
Range |
Volume |
Fri 05 December 2025 |
153.25 (0.13%) |
152.05 |
148.00 - 154.90 |
0.1036 times |
Thu 04 December 2025 |
153.05 (-1.58%) |
148.65 |
148.60 - 158.55 |
0.1717 times |
Wed 03 December 2025 |
155.50 (2%) |
152.90 |
151.05 - 157.35 |
0.238 times |
Tue 02 December 2025 |
152.45 (-3.3%) |
158.00 |
150.15 - 160.35 |
7.9822 times |
Mon 01 December 2025 |
157.65 (-2.05%) |
153.00 |
153.00 - 160.00 |
0.1382 times |
Fri 28 November 2025 |
160.95 (0.56%) |
156.00 |
156.00 - 162.65 |
0.091 times |
Thu 27 November 2025 |
160.05 (-0.53%) |
160.90 |
157.50 - 160.90 |
0.1473 times |
Wed 26 November 2025 |
160.90 (0.72%) |
159.75 |
157.50 - 160.95 |
0.1935 times |
Tue 25 November 2025 |
159.75 (-0.16%) |
167.65 |
156.55 - 167.65 |
0.1653 times |
Mon 24 November 2025 |
160.00 (0.19%) |
156.55 |
156.55 - 167.55 |
0.7694 times |
Fri 21 November 2025 |
159.70 (-1.08%) |
160.00 |
158.00 - 168.95 |
0.2161 times |
Weekly price and charts UvDer Strong weekly Stock price targets for UvDer 522091 are 150.63 and 162.98 | Weekly Target 1 | 141.52 | | Weekly Target 2 | 147.38 | | Weekly Target 3 | 153.86666666667 | | Weekly Target 4 | 159.73 | | Weekly Target 5 | 166.22 |
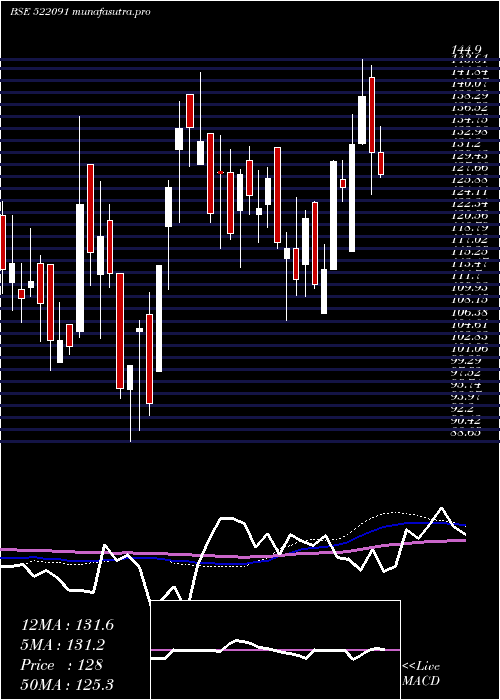
Weekly price and volumes for Uv Der
| Date |
Closing |
Open |
Range |
Volume |
Fri 05 December 2025 |
153.25 (-4.78%) |
153.00 |
148.00 - 160.35 |
1.7282 times |
Fri 28 November 2025 |
160.95 (0.78%) |
156.55 |
156.00 - 167.65 |
0.2735 times |
Fri 21 November 2025 |
159.70 (-16.45%) |
195.00 |
158.00 - 195.00 |
1.3148 times |
Fri 14 November 2025 |
191.15 (-9.86%) |
219.70 |
185.00 - 219.70 |
1.546 times |
Fri 07 November 2025 |
212.05 (-1.35%) |
222.55 |
197.00 - 222.55 |
0.3138 times |
Fri 31 October 2025 |
214.95 (1.92%) |
214.00 |
205.05 - 230.00 |
0.3729 times |
Thu 23 October 2025 |
210.90 (4.48%) |
211.85 |
195.50 - 223.80 |
0.4201 times |
Fri 17 October 2025 |
201.85 (-15.21%) |
226.15 |
193.80 - 234.95 |
1.2243 times |
Fri 10 October 2025 |
238.05 (-5.44%) |
245.45 |
227.25 - 276.85 |
1.334 times |
Fri 03 October 2025 |
251.75 (-14.2%) |
297.85 |
251.75 - 308.05 |
1.4724 times |
Fri 26 September 2025 |
293.40 (56.86%) |
185.10 |
185.00 - 295.10 |
3.7975 times |
Monthly price and charts UvDer Strong monthly Stock price targets for UvDer 522091 are 150.63 and 162.98 | Monthly Target 1 | 141.52 | | Monthly Target 2 | 147.38 | | Monthly Target 3 | 153.86666666667 | | Monthly Target 4 | 159.73 | | Monthly Target 5 | 166.22 |
Monthly price and volumes Uv Der
| Date |
Closing |
Open |
Range |
Volume |
Fri 05 December 2025 |
153.25 (-4.78%) |
153.00 |
148.00 - 160.35 |
0.5696 times |
Fri 28 November 2025 |
160.95 (-25.12%) |
222.55 |
156.00 - 222.55 |
1.1365 times |
Fri 31 October 2025 |
214.95 (-22.93%) |
265.00 |
193.80 - 276.85 |
1.191 times |
Tue 30 September 2025 |
278.90 (80.17%) |
155.00 |
151.20 - 308.05 |
2.645 times |
Fri 29 August 2025 |
154.80 (15.91%) |
133.00 |
130.25 - 165.25 |
0.4521 times |
Thu 31 July 2025 |
133.55 (4.99%) |
127.50 |
123.35 - 145.00 |
2.122 times |
Mon 30 June 2025 |
127.20 (-12.22%) |
147.80 |
121.05 - 150.00 |
0.9398 times |
Fri 30 May 2025 |
144.90 (13.2%) |
130.60 |
117.00 - 149.95 |
0.3539 times |
Wed 30 April 2025 |
128.00 (-1.42%) |
127.25 |
116.60 - 144.90 |
0.369 times |
Fri 28 March 2025 |
129.85 (15.47%) |
114.70 |
107.50 - 130.00 |
0.221 times |
Fri 28 February 2025 |
112.45 (-8.58%) |
123.60 |
106.50 - 131.90 |
0.2247 times |

DMA SMA EMA moving averages of Uv Der 522091
DMA (daily moving average) of Uv Der 522091
| DMA period | DMA value | | 5 day DMA | 154.38 | | 12 day DMA | 157.89 | | 20 day DMA | 171.64 | | 35 day DMA | 189.82 | | 50 day DMA | 207.25 | | 100 day DMA | 179.41 | | 150 day DMA | 164.01 | | 200 day DMA | 153.52 | EMA (exponential moving average) of Uv Der 522091
| EMA period | EMA current | EMA prev | EMA prev2 | | 5 day EMA | 154.9 | 155.72 | 157.05 | | 12 day EMA | 161.61 | 163.13 | 164.96 | | 20 day EMA | 170.66 | 172.49 | 174.54 | | 35 day EMA | 184.78 | 186.64 | 188.62 | | 50 day EMA | 199.95 | 201.86 | 203.85 |
SMA (simple moving average) of Uv Der 522091
| SMA period | SMA current | SMA prev | SMA prev2 | | 5 day SMA | 154.38 | 155.92 | 157.32 | | 12 day SMA | 157.89 | 159.57 | 162.02 | | 20 day SMA | 171.64 | 174.29 | 177.44 | | 35 day SMA | 189.82 | 191.9 | 194.33 | | 50 day SMA | 207.25 | 207.92 | 208.58 | | 100 day SMA | 179.41 | 179.16 | 178.95 | | 150 day SMA | 164.01 | 163.88 | 163.73 | | 200 day SMA | 153.52 | 153.36 | 153.21 |
|
|
