Cranex 522001 full analysis,charts,indicators,moving averages,SMA,DMA,EMA,ADX,MACD,RSICranex 522001 WideScreen charts, DMA,SMA,EMA technical analysis, forecast prediction, by indicators ADX,MACD,RSI,CCI BSE stock exchange
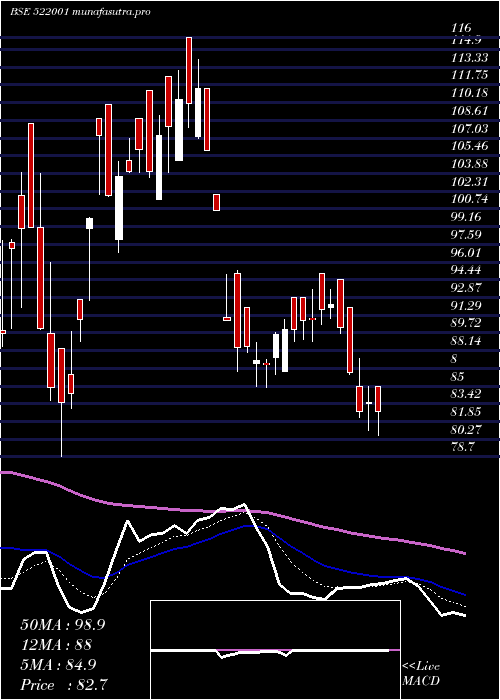
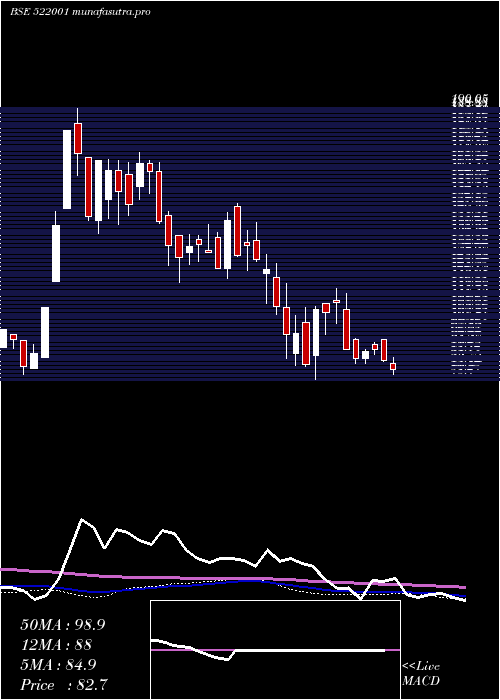
Daily price and charts and targets Cranex Strong Daily Stock price targets for Cranex 522001 are 81.79 and 82.89 | Daily Target 1 | 81.49 | | Daily Target 2 | 82.09 | | Daily Target 3 | 82.593333333333 | | Daily Target 4 | 83.19 | | Daily Target 5 | 83.69 |
Daily price and volume Cranex
| Date |
Closing |
Open |
Range |
Volume |
Tue 21 October 2025 |
82.68 (-0.55%) |
83.00 |
82.00 - 83.10 |
0.2422 times |
Mon 20 October 2025 |
83.14 (6.18%) |
78.35 |
78.30 - 84.40 |
0.4815 times |
Fri 17 October 2025 |
78.30 (0.35%) |
78.15 |
78.03 - 81.19 |
0.5347 times |
Thu 16 October 2025 |
78.03 (-1.91%) |
80.00 |
77.00 - 81.90 |
1.2934 times |
Wed 15 October 2025 |
79.55 (-1.73%) |
81.00 |
78.20 - 82.00 |
1.1673 times |
Tue 14 October 2025 |
80.95 (-1.75%) |
83.40 |
78.50 - 83.40 |
0.3853 times |
Mon 13 October 2025 |
82.39 (4.66%) |
77.50 |
77.50 - 83.84 |
0.6224 times |
Fri 10 October 2025 |
78.72 (-1.03%) |
79.54 |
77.25 - 81.25 |
1.8021 times |
Thu 09 October 2025 |
79.54 (-0.24%) |
84.85 |
78.95 - 84.85 |
0.9025 times |
Wed 08 October 2025 |
79.73 (0.89%) |
79.10 |
79.10 - 82.89 |
2.5687 times |
Tue 07 October 2025 |
79.03 (-9.19%) |
87.02 |
77.95 - 87.02 |
14.643 times |
Weekly price and charts Cranex Strong weekly Stock price targets for Cranex 522001 are 80.49 and 86.59 | Weekly Target 1 | 75.69 | | Weekly Target 2 | 79.19 | | Weekly Target 3 | 81.793333333333 | | Weekly Target 4 | 85.29 | | Weekly Target 5 | 87.89 |
Weekly price and volumes for Cranex
| Date |
Closing |
Open |
Range |
Volume |
Tue 21 October 2025 |
82.68 (5.59%) |
78.35 |
78.30 - 84.40 |
0.0617 times |
Fri 17 October 2025 |
78.30 (-0.53%) |
77.50 |
77.00 - 83.84 |
0.3416 times |
Fri 10 October 2025 |
78.72 (-9.04%) |
90.00 |
77.25 - 90.00 |
1.879 times |
Fri 03 October 2025 |
86.54 (1.28%) |
85.45 |
79.00 - 94.00 |
0.9327 times |
Fri 26 September 2025 |
85.45 (0.91%) |
81.20 |
81.00 - 90.99 |
1.0529 times |
Fri 19 September 2025 |
84.68 (-1.34%) |
89.00 |
83.42 - 93.00 |
0.8787 times |
Fri 12 September 2025 |
85.83 (-1.29%) |
89.99 |
83.55 - 91.90 |
0.962 times |
Fri 05 September 2025 |
86.95 (-1.7%) |
86.25 |
84.01 - 89.90 |
0.5406 times |
Fri 29 August 2025 |
88.45 (13.11%) |
80.79 |
76.21 - 95.40 |
2.0024 times |
Fri 22 August 2025 |
78.20 (-0.76%) |
81.85 |
75.00 - 83.99 |
1.3484 times |
Thu 14 August 2025 |
78.80 (-5.24%) |
85.50 |
77.11 - 85.50 |
0.8619 times |
Monthly price and charts Cranex Strong monthly Stock price targets for Cranex 522001 are 71.34 and 88.34 | Monthly Target 1 | 67.56 | | Monthly Target 2 | 75.12 | | Monthly Target 3 | 84.56 | | Monthly Target 4 | 92.12 | | Monthly Target 5 | 101.56 |
Monthly price and volumes Cranex
| Date |
Closing |
Open |
Range |
Volume |
Tue 21 October 2025 |
82.68 (-0.37%) |
84.85 |
77.00 - 94.00 |
0.49 times |
Tue 30 September 2025 |
82.99 (-6.17%) |
86.25 |
79.00 - 93.00 |
0.6159 times |
Fri 29 August 2025 |
88.45 (3.8%) |
86.95 |
75.00 - 95.40 |
0.9559 times |
Thu 31 July 2025 |
85.21 (3.04%) |
83.00 |
77.30 - 94.85 |
1.4937 times |
Mon 30 June 2025 |
82.70 (-9.52%) |
94.50 |
80.00 - 98.50 |
1.0807 times |
Fri 30 May 2025 |
91.40 (10.47%) |
84.39 |
77.00 - 97.99 |
1.4317 times |
Wed 30 April 2025 |
82.74 (-8.9%) |
95.00 |
80.65 - 95.30 |
0.5476 times |
Fri 28 March 2025 |
90.82 (7.04%) |
88.35 |
78.70 - 116.00 |
1.2926 times |
Fri 28 February 2025 |
84.85 (-31.43%) |
120.50 |
83.75 - 126.40 |
1.0093 times |
Fri 31 January 2025 |
123.75 (-9.44%) |
136.65 |
109.95 - 150.85 |
1.0825 times |
Tue 31 December 2024 |
136.65 (5.97%) |
131.00 |
120.00 - 142.40 |
0.9787 times |

DMA SMA EMA moving averages of Cranex 522001
DMA (daily moving average) of Cranex 522001
| DMA period | DMA value | | 5 day DMA | 80.34 | | 12 day DMA | 80.76 | | 20 day DMA | 82.19 | | 35 day DMA | 84.04 | | 50 day DMA | 83.4 | | 100 day DMA | 85.08 | | 150 day DMA | 87.6 | | 200 day DMA | 95.04 | EMA (exponential moving average) of Cranex 522001
| EMA period | EMA current | EMA prev | EMA prev2 | | 5 day EMA | 81.25 | 80.53 | 79.23 | | 12 day EMA | 81.31 | 81.06 | 80.68 | | 20 day EMA | 81.98 | 81.91 | 81.78 | | 35 day EMA | 82.55 | 82.54 | 82.5 | | 50 day EMA | 83.29 | 83.31 | 83.32 |
SMA (simple moving average) of Cranex 522001
| SMA period | SMA current | SMA prev | SMA prev2 | | 5 day SMA | 80.34 | 79.99 | 79.84 | | 12 day SMA | 80.76 | 81.08 | 80.99 | | 20 day SMA | 82.19 | 82.45 | 82.53 | | 35 day SMA | 84.04 | 84.09 | 84.25 | | 50 day SMA | 83.4 | 83.47 | 83.54 | | 100 day SMA | 85.08 | 85.18 | 85.28 | | 150 day SMA | 87.6 | 87.65 | 87.66 | | 200 day SMA | 95.04 | 95.3 | 95.54 |
|
|
