SamtexFash 521206 full analysis,charts,indicators,moving averages,SMA,DMA,EMA,ADX,MACD,RSISamtex Fash 521206 WideScreen charts, DMA,SMA,EMA technical analysis, forecast prediction, by indicators ADX,MACD,RSI,CCI BSE stock exchange
Daily price and charts and targets SamtexFash Strong Daily Stock price targets for SamtexFash 521206 are 2.28 and 2.36 | Daily Target 1 | 2.22 | | Daily Target 2 | 2.25 | | Daily Target 3 | 2.2966666666667 | | Daily Target 4 | 2.33 | | Daily Target 5 | 2.38 |
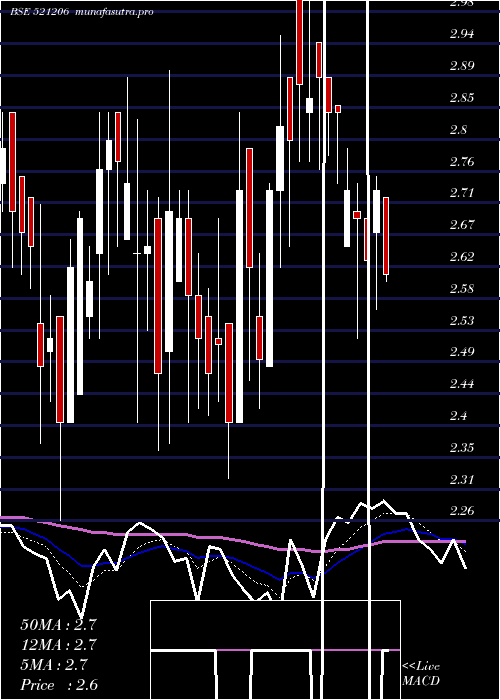
Daily price and volume Samtex Fash
| Date |
Closing |
Open |
Range |
Volume |
Tue 21 October 2025 |
2.29 (0.88%) |
2.27 |
2.26 - 2.34 |
0.0712 times |
Mon 20 October 2025 |
2.27 (0.89%) |
2.28 |
2.13 - 2.29 |
2.0508 times |
Fri 17 October 2025 |
2.25 (0%) |
2.32 |
2.23 - 2.32 |
0.1686 times |
Thu 16 October 2025 |
2.25 (-1.32%) |
2.25 |
2.23 - 2.32 |
0.9169 times |
Wed 15 October 2025 |
2.28 (0.44%) |
2.27 |
2.23 - 2.31 |
0.3219 times |
Tue 14 October 2025 |
2.27 (1.79%) |
2.30 |
2.23 - 2.30 |
0.3395 times |
Mon 13 October 2025 |
2.23 (-2.19%) |
2.28 |
2.21 - 2.35 |
0.918 times |
Fri 10 October 2025 |
2.28 (0%) |
2.24 |
2.20 - 2.34 |
2.8254 times |
Thu 09 October 2025 |
2.28 (-1.72%) |
2.32 |
2.23 - 2.40 |
1.2645 times |
Wed 08 October 2025 |
2.32 (0%) |
2.33 |
2.32 - 2.43 |
1.1233 times |
Tue 07 October 2025 |
2.32 (-4.53%) |
2.43 |
2.30 - 2.43 |
1.1091 times |
Weekly price and charts SamtexFash Strong weekly Stock price targets for SamtexFash 521206 are 2.21 and 2.42 | Weekly Target 1 | 2.04 | | Weekly Target 2 | 2.17 | | Weekly Target 3 | 2.2533333333333 | | Weekly Target 4 | 2.38 | | Weekly Target 5 | 2.46 |
Weekly price and volumes for Samtex Fash
| Date |
Closing |
Open |
Range |
Volume |
Tue 21 October 2025 |
2.29 (1.78%) |
2.28 |
2.13 - 2.34 |
0.248 times |
Fri 17 October 2025 |
2.25 (-1.32%) |
2.28 |
2.21 - 2.35 |
0.3115 times |
Fri 10 October 2025 |
2.28 (-6.17%) |
2.46 |
2.20 - 2.46 |
0.8328 times |
Fri 03 October 2025 |
2.43 (2.1%) |
2.36 |
2.32 - 2.50 |
0.2031 times |
Fri 26 September 2025 |
2.38 (-4.8%) |
2.45 |
2.35 - 2.49 |
0.7756 times |
Fri 19 September 2025 |
2.50 (5.49%) |
2.37 |
2.32 - 2.83 |
5.7447 times |
Fri 12 September 2025 |
2.37 (1.72%) |
2.43 |
2.32 - 2.50 |
0.3942 times |
Fri 05 September 2025 |
2.33 (-2.1%) |
2.44 |
2.28 - 2.54 |
0.5022 times |
Fri 29 August 2025 |
2.38 (-8.11%) |
2.54 |
2.33 - 2.62 |
0.5988 times |
Fri 22 August 2025 |
2.59 (14.1%) |
2.27 |
2.20 - 2.64 |
0.3889 times |
Thu 14 August 2025 |
2.27 (0.89%) |
2.30 |
2.23 - 2.57 |
0.236 times |

Monthly price and charts SamtexFash Strong monthly Stock price targets for SamtexFash 521206 are 2.05 and 2.38 | Monthly Target 1 | 1.96 | | Monthly Target 2 | 2.13 | | Monthly Target 3 | 2.2933333333333 | | Monthly Target 4 | 2.46 | | Monthly Target 5 | 2.62 |
Monthly price and volumes Samtex Fash
| Date |
Closing |
Open |
Range |
Volume |
Tue 21 October 2025 |
2.29 (-1.29%) |
2.32 |
2.13 - 2.46 |
0.4937 times |
Tue 30 September 2025 |
2.32 (-2.52%) |
2.44 |
2.28 - 2.83 |
2.5238 times |
Fri 29 August 2025 |
2.38 (4.85%) |
2.26 |
2.20 - 2.64 |
0.509 times |
Thu 31 July 2025 |
2.27 (-15.93%) |
2.65 |
2.18 - 2.74 |
1.1075 times |
Mon 30 June 2025 |
2.70 (-0.74%) |
2.66 |
2.53 - 3.20 |
0.8577 times |
Fri 30 May 2025 |
2.72 (4.21%) |
2.56 |
2.55 - 2.94 |
0.5946 times |
Wed 30 April 2025 |
2.61 (8.75%) |
2.40 |
2.40 - 3.10 |
0.7179 times |
Fri 28 March 2025 |
2.40 (-4.76%) |
2.55 |
2.26 - 2.90 |
1.0156 times |
Fri 28 February 2025 |
2.52 (-13.4%) |
2.79 |
2.37 - 3.30 |
0.8976 times |
Fri 31 January 2025 |
2.91 (0.69%) |
2.89 |
2.32 - 3.05 |
1.2827 times |
Tue 31 December 2024 |
2.89 (-5.25%) |
3.10 |
2.80 - 3.94 |
4.4409 times |

DMA SMA EMA moving averages of Samtex Fash 521206
DMA (daily moving average) of Samtex Fash 521206
| DMA period | DMA value | | 5 day DMA | 2.27 | | 12 day DMA | 2.29 | | 20 day DMA | 2.33 | | 35 day DMA | 2.37 | | 50 day DMA | 2.39 | | 100 day DMA | 2.49 | | 150 day DMA | 2.56 | | 200 day DMA | 2.61 | EMA (exponential moving average) of Samtex Fash 521206
| EMA period | EMA current | EMA prev | EMA prev2 | | 5 day EMA | 2.27 | 2.26 | 2.26 | | 12 day EMA | 2.29 | 2.29 | 2.29 | | 20 day EMA | 2.32 | 2.32 | 2.32 | | 35 day EMA | 2.34 | 2.34 | 2.34 | | 50 day EMA | 2.38 | 2.38 | 2.38 |
SMA (simple moving average) of Samtex Fash 521206
| SMA period | SMA current | SMA prev | SMA prev2 | | 5 day SMA | 2.27 | 2.26 | 2.26 | | 12 day SMA | 2.29 | 2.3 | 2.31 | | 20 day SMA | 2.33 | 2.34 | 2.35 | | 35 day SMA | 2.37 | 2.37 | 2.37 | | 50 day SMA | 2.39 | 2.39 | 2.4 | | 100 day SMA | 2.49 | 2.5 | 2.5 | | 150 day SMA | 2.56 | 2.57 | 2.57 | | 200 day SMA | 2.61 | 2.62 | 2.62 |
|
|
