SilInvest 521194 full analysis,charts,indicators,moving averages,SMA,DMA,EMA,ADX,MACD,RSISil Invest 521194 WideScreen charts, DMA,SMA,EMA technical analysis, forecast prediction, by indicators ADX,MACD,RSI,CCI BSE stock exchange
Daily price and charts and targets SilInvest Strong Daily Stock price targets for SilInvest 521194 are 684.35 and 697.35 | Daily Target 1 | 673.9 | | Daily Target 2 | 681.8 | | Daily Target 3 | 686.9 | | Daily Target 4 | 694.8 | | Daily Target 5 | 699.9 |
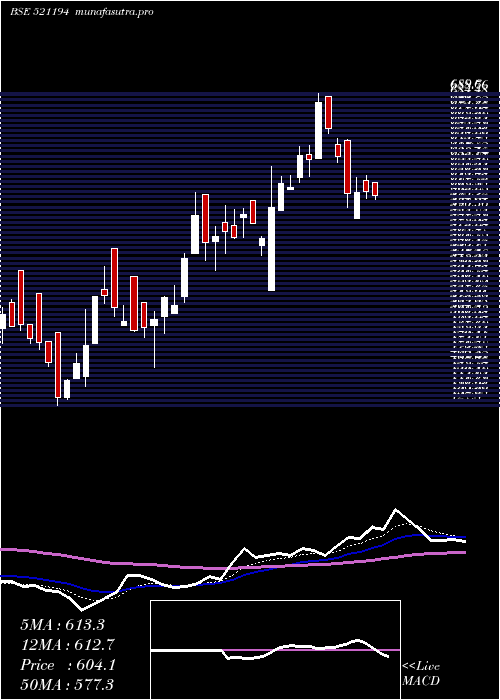
Daily price and volume Sil Invest
| Date |
Closing |
Open |
Range |
Volume |
Tue 21 October 2025 |
689.70 (2.53%) |
679.00 |
679.00 - 692.00 |
0.0731 times |
Mon 20 October 2025 |
672.65 (1.74%) |
669.10 |
668.75 - 687.45 |
0.8914 times |
Fri 17 October 2025 |
661.15 (2.74%) |
679.00 |
652.35 - 772.20 |
7.7734 times |
Thu 16 October 2025 |
643.50 (3.98%) |
630.00 |
630.00 - 645.85 |
0.2375 times |
Wed 15 October 2025 |
618.85 (1.05%) |
610.00 |
605.45 - 636.85 |
0.5917 times |
Tue 14 October 2025 |
612.40 (-0.72%) |
620.60 |
608.25 - 622.25 |
0.044 times |
Mon 13 October 2025 |
616.85 (-2.86%) |
640.00 |
616.00 - 640.00 |
0.0485 times |
Fri 10 October 2025 |
635.00 (0.27%) |
640.00 |
626.25 - 640.00 |
0.1273 times |
Thu 09 October 2025 |
633.30 (-0.4%) |
635.00 |
626.00 - 639.00 |
0.1007 times |
Wed 08 October 2025 |
635.85 (0.77%) |
631.00 |
622.30 - 642.00 |
0.1122 times |
Tue 07 October 2025 |
631.00 (0.53%) |
636.10 |
631.00 - 636.10 |
0.0313 times |
Weekly price and charts SilInvest Strong weekly Stock price targets for SilInvest 521194 are 679.23 and 702.48 | Weekly Target 1 | 660.23 | | Weekly Target 2 | 674.97 | | Weekly Target 3 | 683.48333333333 | | Weekly Target 4 | 698.22 | | Weekly Target 5 | 706.73 |
Weekly price and volumes for Sil Invest
| Date |
Closing |
Open |
Range |
Volume |
Tue 21 October 2025 |
689.70 (4.32%) |
669.10 |
668.75 - 692.00 |
0.6824 times |
Fri 17 October 2025 |
661.15 (4.12%) |
640.00 |
605.45 - 772.20 |
6.1516 times |
Fri 10 October 2025 |
635.00 (-0.63%) |
637.85 |
622.30 - 645.00 |
0.3449 times |
Fri 03 October 2025 |
639.05 (6.09%) |
603.20 |
595.05 - 644.00 |
0.4876 times |
Fri 26 September 2025 |
602.35 (2.42%) |
580.10 |
580.00 - 625.90 |
0.4464 times |
Fri 19 September 2025 |
588.10 (0.7%) |
585.00 |
575.65 - 598.00 |
0.3294 times |
Fri 12 September 2025 |
584.00 (1.02%) |
574.85 |
573.95 - 598.75 |
0.0882 times |
Fri 05 September 2025 |
578.10 (2.62%) |
555.85 |
548.45 - 597.35 |
0.4626 times |
Fri 29 August 2025 |
563.35 (-2.7%) |
553.05 |
553.05 - 593.35 |
0.208 times |
Fri 22 August 2025 |
579.00 (2.78%) |
580.00 |
531.55 - 585.00 |
0.7989 times |
Thu 14 August 2025 |
563.35 (-1.17%) |
569.30 |
540.00 - 591.00 |
2.6976 times |

Monthly price and charts SilInvest Strong monthly Stock price targets for SilInvest 521194 are 645.38 and 816.53 | Monthly Target 1 | 516.5 | | Monthly Target 2 | 603.1 | | Monthly Target 3 | 687.65 | | Monthly Target 4 | 774.25 | | Monthly Target 5 | 858.8 |
Monthly price and volumes Sil Invest
| Date |
Closing |
Open |
Range |
Volume |
Tue 21 October 2025 |
689.70 (13.25%) |
601.05 |
601.05 - 772.20 |
2.151 times |
Tue 30 September 2025 |
609.00 (8.1%) |
555.85 |
548.45 - 625.90 |
0.3942 times |
Fri 29 August 2025 |
563.35 (-3.6%) |
572.45 |
531.55 - 597.35 |
1.4317 times |
Thu 31 July 2025 |
584.40 (-3.93%) |
608.30 |
572.00 - 654.95 |
0.7077 times |
Mon 30 June 2025 |
608.30 (-2.3%) |
616.20 |
582.75 - 644.95 |
1.066 times |
Fri 30 May 2025 |
622.60 (3.07%) |
618.30 |
550.65 - 654.00 |
0.7443 times |
Wed 30 April 2025 |
604.05 (5.21%) |
579.00 |
525.05 - 689.60 |
0.676 times |
Fri 28 March 2025 |
574.15 (23.62%) |
489.80 |
427.80 - 606.50 |
1.8566 times |
Fri 28 February 2025 |
464.45 (-15.2%) |
557.55 |
460.50 - 583.00 |
0.4444 times |
Fri 31 January 2025 |
547.70 (-17.78%) |
647.70 |
529.60 - 691.20 |
0.528 times |
Tue 31 December 2024 |
666.10 (-2.92%) |
698.80 |
644.10 - 750.00 |
0.8803 times |

DMA SMA EMA moving averages of Sil Invest 521194
DMA (daily moving average) of Sil Invest 521194
| DMA period | DMA value | | 5 day DMA | 657.17 | | 12 day DMA | 639.83 | | 20 day DMA | 628.86 | | 35 day DMA | 610.19 | | 50 day DMA | 596.85 | | 100 day DMA | 598.66 | | 150 day DMA | 594.3 | | 200 day DMA | 589.54 | EMA (exponential moving average) of Sil Invest 521194
| EMA period | EMA current | EMA prev | EMA prev2 | | 5 day EMA | 663.54 | 650.46 | 639.36 | | 12 day EMA | 644.14 | 635.86 | 629.17 | | 20 day EMA | 631.81 | 625.72 | 620.78 | | 35 day EMA | 616.09 | 611.76 | 608.18 | | 50 day EMA | 601.49 | 597.89 | 594.84 |
SMA (simple moving average) of Sil Invest 521194
| SMA period | SMA current | SMA prev | SMA prev2 | | 5 day SMA | 657.17 | 641.71 | 630.55 | | 12 day SMA | 639.83 | 635.6 | 631.23 | | 20 day SMA | 628.86 | 624.02 | 619.8 | | 35 day SMA | 610.19 | 606.49 | 603.36 | | 50 day SMA | 596.85 | 594.46 | 592.57 | | 100 day SMA | 598.66 | 597.9 | 597.36 | | 150 day SMA | 594.3 | 592.7 | 591.11 | | 200 day SMA | 589.54 | 589.45 | 589.49 |
|
|
