Trident 521064 full analysis,charts,indicators,moving averages,SMA,DMA,EMA,ADX,MACD,RSITrident 521064 WideScreen charts, DMA,SMA,EMA technical analysis, forecast prediction, by indicators ADX,MACD,RSI,CCI BSE stock exchange
Daily price and charts and targets Trident Strong Daily Stock price targets for Trident 521064 are 27.98 and 28.52 | Daily Target 1 | 27.55 | | Daily Target 2 | 27.87 | | Daily Target 3 | 28.086666666667 | | Daily Target 4 | 28.41 | | Daily Target 5 | 28.63 |
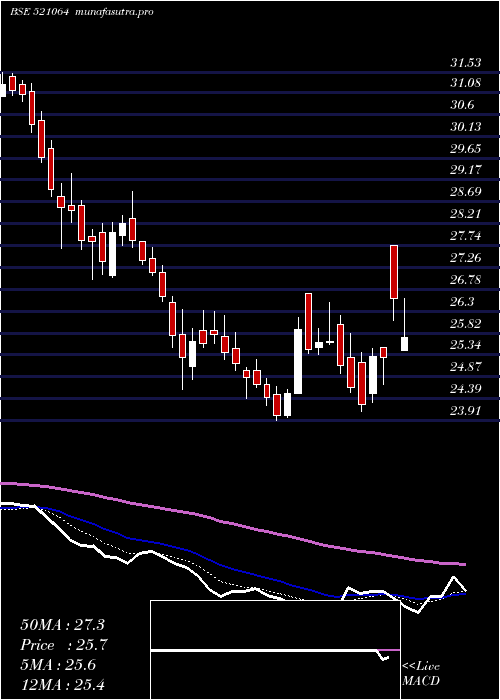
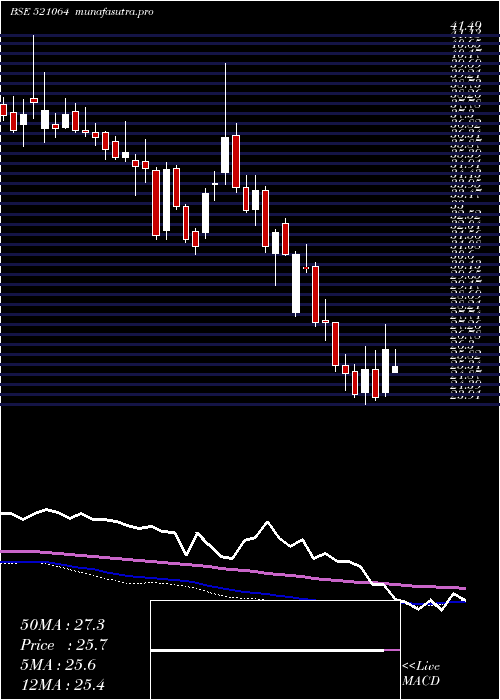
Daily price and volume Trident
| Date |
Closing |
Open |
Range |
Volume |
Tue 21 October 2025 |
28.20 (0.97%) |
27.76 |
27.76 - 28.30 |
0.8776 times |
Mon 20 October 2025 |
27.93 (0.04%) |
27.86 |
27.62 - 28.07 |
1.2668 times |
Fri 17 October 2025 |
27.92 (-0.57%) |
27.96 |
27.81 - 28.13 |
1.3705 times |
Thu 16 October 2025 |
28.08 (0.93%) |
27.85 |
27.85 - 28.45 |
0.5282 times |
Wed 15 October 2025 |
27.82 (-0.11%) |
27.80 |
27.75 - 27.99 |
1.4978 times |
Tue 14 October 2025 |
27.85 (-1.17%) |
28.13 |
27.80 - 28.30 |
1.4272 times |
Mon 13 October 2025 |
28.18 (-0.6%) |
28.20 |
28.08 - 28.36 |
1.2795 times |
Fri 10 October 2025 |
28.35 (0.89%) |
28.10 |
28.10 - 28.56 |
0.6639 times |
Thu 09 October 2025 |
28.10 (-0.67%) |
28.15 |
28.01 - 28.37 |
0.5146 times |
Wed 08 October 2025 |
28.29 (-0.11%) |
28.33 |
28.14 - 28.50 |
0.574 times |
Tue 07 October 2025 |
28.32 (-0.35%) |
28.14 |
28.14 - 28.59 |
1.3498 times |
Weekly price and charts Trident Strong weekly Stock price targets for Trident 521064 are 27.91 and 28.59 | Weekly Target 1 | 27.36 | | Weekly Target 2 | 27.78 | | Weekly Target 3 | 28.04 | | Weekly Target 4 | 28.46 | | Weekly Target 5 | 28.72 |
Weekly price and volumes for Trident
| Date |
Closing |
Open |
Range |
Volume |
Tue 21 October 2025 |
28.20 (1%) |
27.86 |
27.62 - 28.30 |
0.2697 times |
Fri 17 October 2025 |
27.92 (-1.52%) |
28.20 |
27.75 - 28.45 |
0.7676 times |
Fri 10 October 2025 |
28.35 (-0.84%) |
28.65 |
28.01 - 28.81 |
0.4747 times |
Fri 03 October 2025 |
28.59 (-0.31%) |
28.57 |
28.00 - 28.76 |
0.4904 times |
Fri 26 September 2025 |
28.68 (-4.78%) |
29.19 |
28.40 - 30.64 |
1.232 times |
Fri 19 September 2025 |
30.12 (4.33%) |
29.11 |
28.83 - 30.36 |
1.395 times |
Fri 12 September 2025 |
28.87 (2.16%) |
28.28 |
28.04 - 30.00 |
2.038 times |
Fri 05 September 2025 |
28.26 (3.14%) |
27.35 |
27.30 - 29.02 |
1.3284 times |
Fri 29 August 2025 |
27.40 (-3.89%) |
28.29 |
27.15 - 28.70 |
0.8598 times |
Fri 22 August 2025 |
28.51 (2%) |
28.04 |
28.03 - 29.14 |
1.1445 times |
Thu 14 August 2025 |
27.95 (0.9%) |
27.74 |
27.25 - 28.30 |
0.8237 times |
Monthly price and charts Trident Strong monthly Stock price targets for Trident 521064 are 27.91 and 29.1 | Monthly Target 1 | 27.02 | | Monthly Target 2 | 27.61 | | Monthly Target 3 | 28.21 | | Monthly Target 4 | 28.8 | | Monthly Target 5 | 29.4 |
Monthly price and volumes Trident
| Date |
Closing |
Open |
Range |
Volume |
Tue 21 October 2025 |
28.20 (0.14%) |
28.16 |
27.62 - 28.81 |
0.2421 times |
Tue 30 September 2025 |
28.16 (2.77%) |
27.35 |
27.30 - 30.64 |
0.8455 times |
Fri 29 August 2025 |
27.40 (-8.67%) |
30.00 |
27.15 - 30.10 |
0.7033 times |
Thu 31 July 2025 |
30.00 (-4.18%) |
31.44 |
29.25 - 33.70 |
1.8974 times |
Mon 30 June 2025 |
31.31 (-1.51%) |
31.96 |
29.04 - 33.13 |
1.3621 times |
Fri 30 May 2025 |
31.79 (19.96%) |
26.98 |
26.02 - 34.60 |
1.4215 times |
Wed 30 April 2025 |
26.50 (9.19%) |
24.50 |
24.30 - 29.72 |
0.9561 times |
Fri 28 March 2025 |
24.27 (-5.86%) |
25.79 |
23.91 - 26.69 |
0.9519 times |
Fri 28 February 2025 |
25.78 (-17.08%) |
30.47 |
25.50 - 31.53 |
0.5828 times |
Fri 31 January 2025 |
31.09 (-7.03%) |
33.41 |
28.14 - 34.85 |
1.0372 times |
Tue 31 December 2024 |
33.44 (-1.53%) |
34.42 |
32.47 - 40.17 |
1.9011 times |

DMA SMA EMA moving averages of Trident 521064
DMA (daily moving average) of Trident 521064
| DMA period | DMA value | | 5 day DMA | 27.99 | | 12 day DMA | 28.12 | | 20 day DMA | 28.4 | | 35 day DMA | 28.68 | | 50 day DMA | 28.49 | | 100 day DMA | 29.66 | | 150 day DMA | 28.91 | | 200 day DMA | 29.26 | EMA (exponential moving average) of Trident 521064
| EMA period | EMA current | EMA prev | EMA prev2 | | 5 day EMA | 28.05 | 27.98 | 28.01 | | 12 day EMA | 28.17 | 28.17 | 28.21 | | 20 day EMA | 28.33 | 28.34 | 28.38 | | 35 day EMA | 28.34 | 28.35 | 28.37 | | 50 day EMA | 28.44 | 28.45 | 28.47 |
SMA (simple moving average) of Trident 521064
| SMA period | SMA current | SMA prev | SMA prev2 | | 5 day SMA | 27.99 | 27.92 | 27.97 | | 12 day SMA | 28.12 | 28.15 | 28.19 | | 20 day SMA | 28.4 | 28.5 | 28.61 | | 35 day SMA | 28.68 | 28.67 | 28.65 | | 50 day SMA | 28.49 | 28.49 | 28.49 | | 100 day SMA | 29.66 | 29.71 | 29.75 | | 150 day SMA | 28.91 | 28.89 | 28.87 | | 200 day SMA | 29.26 | 29.29 | 29.32 |
|
|
