BalurghatTe 520127 full analysis,charts,indicators,moving averages,SMA,DMA,EMA,ADX,MACD,RSIBalurghat Te 520127 WideScreen charts, DMA,SMA,EMA technical analysis, forecast prediction, by indicators ADX,MACD,RSI,CCI BSE stock exchange
Daily price and charts and targets BalurghatTe Strong Daily Stock price targets for BalurghatTe 520127 are 17.12 and 18.45 | Daily Target 1 | 16.06 | | Daily Target 2 | 16.84 | | Daily Target 3 | 17.393333333333 | | Daily Target 4 | 18.17 | | Daily Target 5 | 18.72 |
Daily price and volume Balurghat Te
| Date |
Closing |
Open |
Range |
Volume |
Tue 21 October 2025 |
17.61 (4.02%) |
17.50 |
16.62 - 17.95 |
0.5106 times |
Mon 20 October 2025 |
16.93 (2.67%) |
16.57 |
16.56 - 17.49 |
0.1718 times |
Fri 17 October 2025 |
16.49 (2.36%) |
16.50 |
16.40 - 16.50 |
0.1454 times |
Thu 16 October 2025 |
16.11 (-1.89%) |
16.50 |
16.10 - 16.99 |
1.4146 times |
Wed 15 October 2025 |
16.42 (-1.91%) |
16.05 |
16.05 - 17.48 |
1.6882 times |
Tue 14 October 2025 |
16.74 (-1.41%) |
17.00 |
15.15 - 17.00 |
1.5912 times |
Mon 13 October 2025 |
16.98 (2.35%) |
16.40 |
16.35 - 17.25 |
0.9982 times |
Fri 10 October 2025 |
16.59 (-2.87%) |
17.00 |
16.42 - 17.25 |
1.5355 times |
Thu 09 October 2025 |
17.08 (3.2%) |
16.63 |
16.31 - 17.32 |
0.9567 times |
Wed 08 October 2025 |
16.55 (-2.76%) |
17.00 |
16.03 - 17.00 |
0.9878 times |
Tue 07 October 2025 |
17.02 (1.92%) |
16.86 |
16.50 - 17.24 |
0.5278 times |

Weekly price and charts BalurghatTe Strong weekly Stock price targets for BalurghatTe 520127 are 17.09 and 18.48 | Weekly Target 1 | 15.98 | | Weekly Target 2 | 16.8 | | Weekly Target 3 | 17.373333333333 | | Weekly Target 4 | 18.19 | | Weekly Target 5 | 18.76 |
Weekly price and volumes for Balurghat Te
| Date |
Closing |
Open |
Range |
Volume |
Tue 21 October 2025 |
17.61 (6.79%) |
16.57 |
16.56 - 17.95 |
0.0747 times |
Fri 17 October 2025 |
16.49 (-0.6%) |
16.40 |
15.15 - 17.48 |
0.6388 times |
Fri 10 October 2025 |
16.59 (-7.06%) |
17.77 |
16.03 - 18.70 |
0.9665 times |
Fri 03 October 2025 |
17.85 (-0.83%) |
17.75 |
17.10 - 18.75 |
0.3185 times |
Fri 26 September 2025 |
18.00 (-2.44%) |
18.50 |
17.06 - 19.25 |
1.4294 times |
Fri 19 September 2025 |
18.45 (-5.87%) |
19.44 |
18.20 - 19.70 |
1.2766 times |
Fri 12 September 2025 |
19.60 (17.79%) |
16.64 |
16.64 - 21.00 |
3.8722 times |
Fri 05 September 2025 |
16.64 (-1.25%) |
16.93 |
16.20 - 18.90 |
0.5867 times |
Fri 29 August 2025 |
16.85 (-0.53%) |
17.00 |
15.60 - 17.00 |
0.2182 times |
Fri 22 August 2025 |
16.94 (-2.08%) |
17.30 |
16.26 - 17.75 |
0.6184 times |
Thu 14 August 2025 |
17.30 (4.53%) |
16.55 |
16.55 - 19.80 |
0.4672 times |
Monthly price and charts BalurghatTe Strong monthly Stock price targets for BalurghatTe 520127 are 16.38 and 19.93 | Monthly Target 1 | 13.6 | | Monthly Target 2 | 15.61 | | Monthly Target 3 | 17.153333333333 | | Monthly Target 4 | 19.16 | | Monthly Target 5 | 20.7 |
Monthly price and volumes Balurghat Te
| Date |
Closing |
Open |
Range |
Volume |
Tue 21 October 2025 |
17.61 (1.38%) |
17.45 |
15.15 - 18.70 |
0.4208 times |
Tue 30 September 2025 |
17.37 (3.09%) |
16.93 |
16.20 - 21.00 |
1.6249 times |
Fri 29 August 2025 |
16.85 (-7.67%) |
18.25 |
15.60 - 19.80 |
0.4003 times |
Thu 31 July 2025 |
18.25 (-4.7%) |
19.15 |
17.50 - 20.50 |
0.7436 times |
Mon 30 June 2025 |
19.15 (-7.67%) |
20.74 |
18.31 - 22.39 |
0.5629 times |
Fri 30 May 2025 |
20.74 (7.02%) |
19.75 |
17.00 - 22.15 |
1.1102 times |
Wed 30 April 2025 |
19.38 (8.27%) |
18.00 |
17.25 - 24.00 |
1.0506 times |
Fri 28 March 2025 |
17.90 (-9.09%) |
22.60 |
17.01 - 22.75 |
1.3444 times |
Fri 28 February 2025 |
19.69 (-25.67%) |
25.00 |
18.79 - 26.00 |
1.2559 times |
Fri 31 January 2025 |
26.49 (0.23%) |
27.84 |
23.00 - 29.79 |
1.4865 times |
Tue 31 December 2024 |
26.43 (-11.37%) |
31.16 |
25.90 - 33.55 |
1.4519 times |
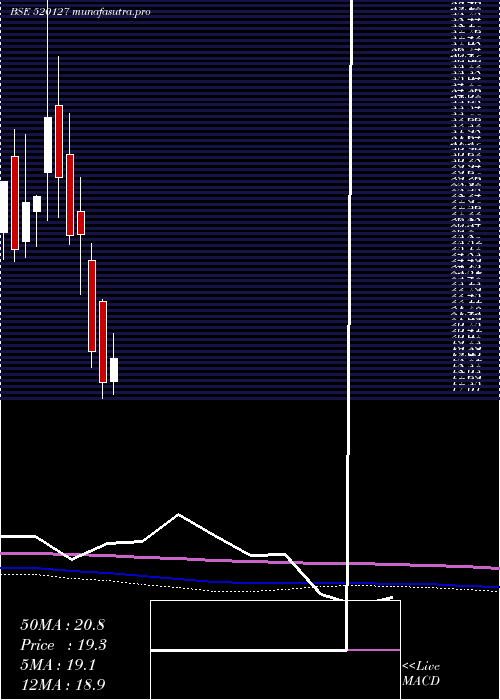
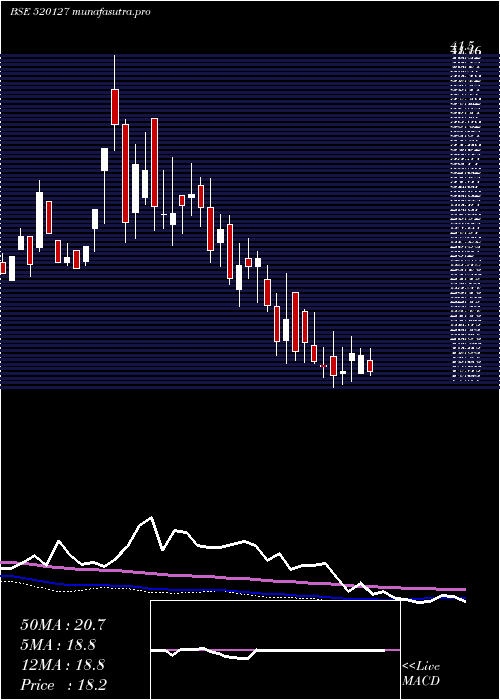
DMA SMA EMA moving averages of Balurghat Te 520127
DMA (daily moving average) of Balurghat Te 520127
| DMA period | DMA value | | 5 day DMA | 16.71 | | 12 day DMA | 16.77 | | 20 day DMA | 17.18 | | 35 day DMA | 17.66 | | 50 day DMA | 17.39 | | 100 day DMA | 18.34 | | 150 day DMA | 18.71 | | 200 day DMA | 20.13 | EMA (exponential moving average) of Balurghat Te 520127
| EMA period | EMA current | EMA prev | EMA prev2 | | 5 day EMA | 16.97 | 16.65 | 16.51 | | 12 day EMA | 16.97 | 16.85 | 16.84 | | 20 day EMA | 17.14 | 17.09 | 17.11 | | 35 day EMA | 17.22 | 17.2 | 17.22 | | 50 day EMA | 17.38 | 17.37 | 17.39 |
SMA (simple moving average) of Balurghat Te 520127
| SMA period | SMA current | SMA prev | SMA prev2 | | 5 day SMA | 16.71 | 16.54 | 16.55 | | 12 day SMA | 16.77 | 16.79 | 16.88 | | 20 day SMA | 17.18 | 17.18 | 17.26 | | 35 day SMA | 17.66 | 17.63 | 17.63 | | 50 day SMA | 17.39 | 17.38 | 17.39 | | 100 day SMA | 18.34 | 18.37 | 18.41 | | 150 day SMA | 18.71 | 18.73 | 18.75 | | 200 day SMA | 20.13 | 20.19 | 20.26 |
|
|
