VesuviusInd 520113 full analysis,charts,indicators,moving averages,SMA,DMA,EMA,ADX,MACD,RSIVesuvius Ind 520113 WideScreen charts, DMA,SMA,EMA technical analysis, forecast prediction, by indicators ADX,MACD,RSI,CCI BSE stock exchange
Daily price and charts and targets VesuviusInd Strong Daily Stock price targets for VesuviusInd 520113 are 474.98 and 489.08 | Daily Target 1 | 472.58 | | Daily Target 2 | 477.37 | | Daily Target 3 | 486.68333333333 | | Daily Target 4 | 491.47 | | Daily Target 5 | 500.78 |
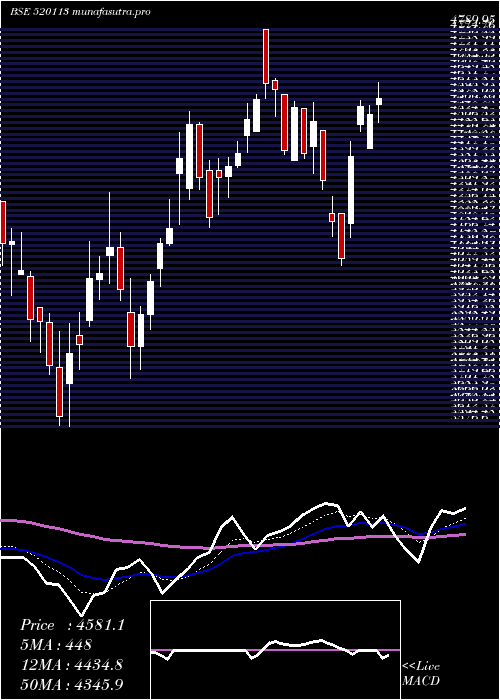
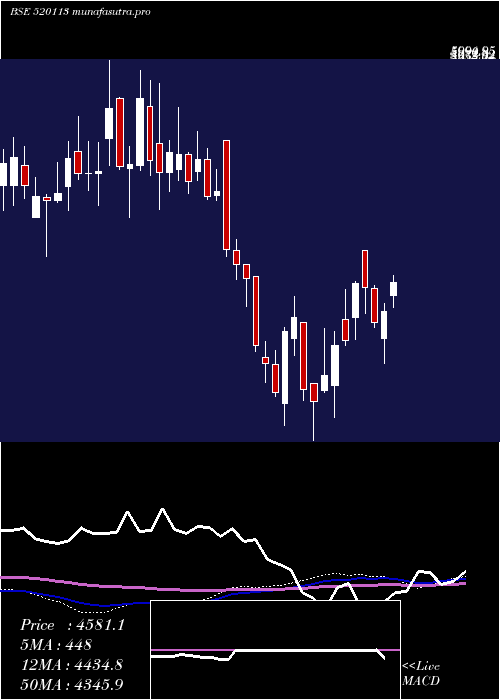
Daily price and volume Vesuvius Ind
| Date |
Closing |
Open |
Range |
Volume |
Thu 23 October 2025 |
482.15 (-2.4%) |
494.60 |
481.90 - 496.00 |
0.1792 times |
Tue 21 October 2025 |
494.00 (2.43%) |
485.15 |
485.15 - 499.95 |
0.0336 times |
Mon 20 October 2025 |
482.30 (0.73%) |
479.00 |
473.20 - 483.80 |
0.0542 times |
Fri 17 October 2025 |
478.80 (-2.8%) |
495.00 |
478.65 - 496.05 |
0.0643 times |
Thu 16 October 2025 |
492.60 (0.48%) |
491.15 |
490.15 - 496.00 |
0.0758 times |
Wed 15 October 2025 |
490.25 (0.94%) |
480.05 |
478.85 - 494.50 |
4.6354 times |
Tue 14 October 2025 |
485.70 (-3.26%) |
504.05 |
483.05 - 504.05 |
0.1839 times |
Mon 13 October 2025 |
502.05 (-0.57%) |
504.00 |
500.00 - 505.75 |
0.0678 times |
Fri 10 October 2025 |
504.95 (0.3%) |
503.85 |
501.05 - 507.70 |
0.0736 times |
Thu 09 October 2025 |
503.45 (-1.39%) |
512.90 |
501.75 - 512.90 |
4.6324 times |
Wed 08 October 2025 |
510.55 (-0.55%) |
514.70 |
507.60 - 517.15 |
0.0531 times |
Weekly price and charts VesuviusInd Strong weekly Stock price targets for VesuviusInd 520113 are 477.68 and 504.43 | Weekly Target 1 | 458.35 | | Weekly Target 2 | 470.25 | | Weekly Target 3 | 485.1 | | Weekly Target 4 | 497 | | Weekly Target 5 | 511.85 |
Weekly price and volumes for Vesuvius Ind
| Date |
Closing |
Open |
Range |
Volume |
Thu 23 October 2025 |
482.15 (0.7%) |
479.00 |
473.20 - 499.95 |
0.1703 times |
Fri 17 October 2025 |
478.80 (-5.18%) |
504.00 |
478.65 - 505.75 |
3.2067 times |
Fri 10 October 2025 |
504.95 (-0.02%) |
519.95 |
496.75 - 521.35 |
3.1766 times |
Fri 03 October 2025 |
505.05 (-0.75%) |
509.05 |
497.00 - 516.05 |
0.2763 times |
Fri 26 September 2025 |
508.85 (-4.35%) |
537.25 |
505.50 - 537.25 |
0.5775 times |
Fri 19 September 2025 |
532.00 (1.82%) |
520.20 |
518.00 - 545.85 |
0.522 times |
Fri 12 September 2025 |
522.50 (2.24%) |
511.35 |
510.00 - 532.00 |
0.4579 times |
Fri 05 September 2025 |
511.05 (1.65%) |
492.55 |
492.55 - 526.05 |
0.4353 times |
Fri 29 August 2025 |
502.75 (-5.44%) |
533.00 |
493.90 - 538.20 |
0.6392 times |
Fri 22 August 2025 |
531.70 (4.54%) |
516.00 |
508.55 - 540.00 |
0.538 times |
Thu 14 August 2025 |
508.60 (-3.75%) |
522.75 |
507.00 - 530.00 |
0.2541 times |
Monthly price and charts VesuviusInd Strong monthly Stock price targets for VesuviusInd 520113 are 453.6 and 501.75 | Monthly Target 1 | 444.08 | | Monthly Target 2 | 463.12 | | Monthly Target 3 | 492.23333333333 | | Monthly Target 4 | 511.27 | | Monthly Target 5 | 540.38 |
Monthly price and volumes Vesuvius Ind
| Date |
Closing |
Open |
Range |
Volume |
Thu 23 October 2025 |
482.15 (-5.96%) |
512.25 |
473.20 - 521.35 |
3.0873 times |
Tue 30 September 2025 |
512.70 (1.98%) |
492.55 |
492.55 - 545.85 |
0.9379 times |
Fri 29 August 2025 |
502.75 (-2.43%) |
518.90 |
493.90 - 560.95 |
1.4182 times |
Thu 31 July 2025 |
515.25 (-6.59%) |
554.35 |
505.00 - 570.00 |
1.5299 times |
Mon 30 June 2025 |
551.60 (-90.68%) |
6000.00 |
530.10 - 6298.95 |
2.0629 times |
Fri 30 May 2025 |
5921.20 (27.33%) |
4780.00 |
4364.00 - 6039.70 |
0.3494 times |
Wed 30 April 2025 |
4650.20 (2.17%) |
4549.20 |
4070.05 - 4739.60 |
0.0848 times |
Fri 28 March 2025 |
4551.45 (13.93%) |
3926.25 |
3723.25 - 4789.95 |
0.2054 times |
Fri 28 February 2025 |
3994.90 (-6.55%) |
4230.00 |
3576.60 - 4493.90 |
0.1858 times |
Fri 31 January 2025 |
4274.90 (-6.13%) |
4549.20 |
3674.95 - 4625.00 |
0.1384 times |
Tue 31 December 2024 |
4554.20 (-15.17%) |
5365.00 |
4429.90 - 5489.95 |
0.1508 times |

DMA SMA EMA moving averages of Vesuvius Ind 520113
DMA (daily moving average) of Vesuvius Ind 520113
| DMA period | DMA value | | 5 day DMA | 485.97 | | 12 day DMA | 495.01 | | 20 day DMA | 501.12 | | 35 day DMA | 509.77 | | 50 day DMA | 511.98 | | 100 day DMA | 909.72 | | 150 day DMA | 2196.6 | | 200 day DMA | 2686.18 | EMA (exponential moving average) of Vesuvius Ind 520113
| EMA period | EMA current | EMA prev | EMA prev2 | | 5 day EMA | 487 | 489.42 | 487.13 | | 12 day EMA | 493.32 | 495.35 | 495.59 | | 20 day EMA | 498.97 | 500.74 | 501.45 | | 35 day EMA | 505.19 | 506.55 | 507.29 | | 50 day EMA | 511.02 | 512.2 | 512.94 |
SMA (simple moving average) of Vesuvius Ind 520113
| SMA period | SMA current | SMA prev | SMA prev2 | | 5 day SMA | 485.97 | 487.59 | 485.93 | | 12 day SMA | 495.01 | 497.67 | 498.59 | | 20 day SMA | 501.12 | 502.84 | 503.71 | | 35 day SMA | 509.77 | 510.72 | 511.15 | | 50 day SMA | 511.98 | 512.91 | 513.77 | | 100 day SMA | 909.72 | 961.02 | 1012.5 | | 150 day SMA | 2196.6 | 2220.95 | 2244.46 | | 200 day SMA | 2686.18 | 2707.94 | 2729.37 |
|
|
