AdfFoods 519183 full analysis,charts,indicators,moving averages,SMA,DMA,EMA,ADX,MACD,RSIAdf Foods 519183 WideScreen charts, DMA,SMA,EMA technical analysis, forecast prediction, by indicators ADX,MACD,RSI,CCI BSE stock exchange
Daily price and charts and targets AdfFoods Strong Daily Stock price targets for AdfFoods 519183 are 209.53 and 215.73 | Daily Target 1 | 205.18 | | Daily Target 2 | 207.67 | | Daily Target 3 | 211.38333333333 | | Daily Target 4 | 213.87 | | Daily Target 5 | 217.58 |
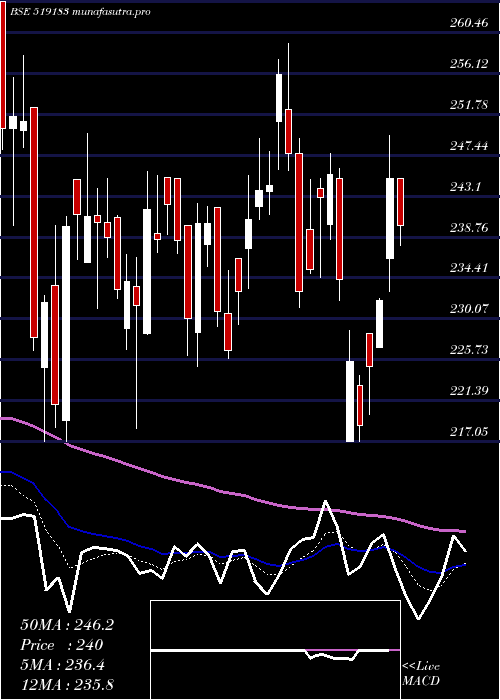
Daily price and volume Adf Foods
| Date |
Closing |
Open |
Range |
Volume |
Thu 23 October 2025 |
210.15 (1.06%) |
209.50 |
208.90 - 215.10 |
1.3184 times |
Tue 21 October 2025 |
207.95 (1.17%) |
202.00 |
202.00 - 209.05 |
0.6152 times |
Mon 20 October 2025 |
205.55 (1.03%) |
204.30 |
201.00 - 207.00 |
0.7631 times |
Fri 17 October 2025 |
203.45 (-0.54%) |
204.80 |
202.05 - 206.00 |
1.1583 times |
Thu 16 October 2025 |
204.55 (0.02%) |
206.45 |
204.10 - 209.55 |
0.4988 times |
Wed 15 October 2025 |
204.50 (2.63%) |
207.90 |
198.40 - 207.90 |
0.8066 times |
Tue 14 October 2025 |
199.25 (-1.85%) |
201.80 |
199.00 - 204.75 |
1.2756 times |
Mon 13 October 2025 |
203.00 (0.32%) |
202.25 |
201.30 - 204.10 |
0.7643 times |
Fri 10 October 2025 |
202.35 (-1.91%) |
206.85 |
202.00 - 206.90 |
1.6514 times |
Thu 09 October 2025 |
206.30 (3.05%) |
200.65 |
200.65 - 208.00 |
1.1484 times |
Wed 08 October 2025 |
200.20 (-6.71%) |
214.60 |
198.65 - 216.30 |
3.6526 times |
Weekly price and charts AdfFoods Strong weekly Stock price targets for AdfFoods 519183 are 205.58 and 219.68 | Weekly Target 1 | 194.65 | | Weekly Target 2 | 202.4 | | Weekly Target 3 | 208.75 | | Weekly Target 4 | 216.5 | | Weekly Target 5 | 222.85 |
Weekly price and volumes for Adf Foods
| Date |
Closing |
Open |
Range |
Volume |
Thu 23 October 2025 |
210.15 (3.29%) |
204.30 |
201.00 - 215.10 |
0.4488 times |
Fri 17 October 2025 |
203.45 (0.54%) |
202.25 |
198.40 - 209.55 |
0.7496 times |
Fri 10 October 2025 |
202.35 (-7.01%) |
216.95 |
198.65 - 220.05 |
1.4739 times |
Fri 03 October 2025 |
217.60 (-1.54%) |
221.00 |
214.00 - 223.20 |
0.3701 times |
Fri 26 September 2025 |
221.00 (-4.54%) |
233.95 |
218.40 - 233.95 |
0.7023 times |
Fri 19 September 2025 |
231.50 (0.81%) |
230.75 |
228.85 - 236.70 |
0.7919 times |
Fri 12 September 2025 |
229.65 (-3.99%) |
239.15 |
225.20 - 241.45 |
1.5403 times |
Fri 05 September 2025 |
239.20 (15.81%) |
207.35 |
207.00 - 247.95 |
2.3954 times |
Fri 29 August 2025 |
206.55 (-9.55%) |
228.75 |
206.00 - 234.95 |
0.9106 times |
Fri 22 August 2025 |
228.35 (0.09%) |
232.00 |
225.00 - 235.35 |
0.617 times |
Thu 14 August 2025 |
228.15 (-1.11%) |
236.00 |
226.30 - 236.00 |
0.3512 times |

Monthly price and charts AdfFoods Strong monthly Stock price targets for AdfFoods 519183 are 192.7 and 215.85 | Monthly Target 1 | 186.88 | | Monthly Target 2 | 198.52 | | Monthly Target 3 | 210.03333333333 | | Monthly Target 4 | 221.67 | | Monthly Target 5 | 233.18 |
Monthly price and volumes Adf Foods
| Date |
Closing |
Open |
Range |
Volume |
Thu 23 October 2025 |
210.15 (-4.02%) |
221.55 |
198.40 - 221.55 |
0.2943 times |
Tue 30 September 2025 |
218.95 (6%) |
207.35 |
207.00 - 247.95 |
0.6087 times |
Fri 29 August 2025 |
206.55 (-16.1%) |
246.20 |
206.00 - 253.05 |
0.4067 times |
Thu 31 July 2025 |
246.20 (-9.57%) |
265.95 |
237.05 - 289.10 |
0.4459 times |
Mon 30 June 2025 |
272.25 (15.36%) |
238.00 |
230.85 - 301.00 |
1.2888 times |
Fri 30 May 2025 |
236.00 (6.33%) |
221.95 |
210.95 - 242.85 |
4.1571 times |
Wed 30 April 2025 |
221.95 (-5.69%) |
243.95 |
217.05 - 249.55 |
0.481 times |
Fri 28 March 2025 |
235.35 (0.56%) |
233.50 |
218.40 - 259.30 |
0.3667 times |
Fri 28 February 2025 |
234.05 (-13.36%) |
275.00 |
217.05 - 278.05 |
1.2946 times |
Fri 31 January 2025 |
270.15 (-8.86%) |
297.95 |
241.25 - 299.65 |
0.6563 times |
Tue 31 December 2024 |
296.40 (-10.76%) |
332.00 |
282.30 - 352.50 |
0.7555 times |

DMA SMA EMA moving averages of Adf Foods 519183
DMA (daily moving average) of Adf Foods 519183
| DMA period | DMA value | | 5 day DMA | 206.33 | | 12 day DMA | 205.15 | | 20 day DMA | 211.09 | | 35 day DMA | 219.85 | | 50 day DMA | 221.06 | | 100 day DMA | 243.5 | | 150 day DMA | 239.61 | | 200 day DMA | 245.39 | EMA (exponential moving average) of Adf Foods 519183
| EMA period | EMA current | EMA prev | EMA prev2 | | 5 day EMA | 207.13 | 205.62 | 204.46 | | 12 day EMA | 207.92 | 207.51 | 207.43 | | 20 day EMA | 211.07 | 211.17 | 211.51 | | 35 day EMA | 215.32 | 215.62 | 216.07 | | 50 day EMA | 220.59 | 221.02 | 221.55 |
SMA (simple moving average) of Adf Foods 519183
| SMA period | SMA current | SMA prev | SMA prev2 | | 5 day SMA | 206.33 | 205.2 | 203.46 | | 12 day SMA | 205.15 | 205.53 | 206.33 | | 20 day SMA | 211.09 | 211.94 | 213.1 | | 35 day SMA | 219.85 | 220.15 | 220.24 | | 50 day SMA | 221.06 | 221.47 | 221.89 | | 100 day SMA | 243.5 | 243.73 | 243.97 | | 150 day SMA | 239.61 | 239.83 | 240.03 | | 200 day SMA | 245.39 | 245.89 | 246.43 |
|
|
