NaharIndust 519136 full analysis,charts,indicators,moving averages,SMA,DMA,EMA,ADX,MACD,RSINahar Indust 519136 WideScreen charts, DMA,SMA,EMA technical analysis, forecast prediction, by indicators ADX,MACD,RSI,CCI BSE stock exchange
Daily price and charts and targets NaharIndust Strong Daily Stock price targets for NaharIndust 519136 are 110.53 and 113.83 | Daily Target 1 | 107.82 | | Daily Target 2 | 109.93 | | Daily Target 3 | 111.11666666667 | | Daily Target 4 | 113.23 | | Daily Target 5 | 114.42 |
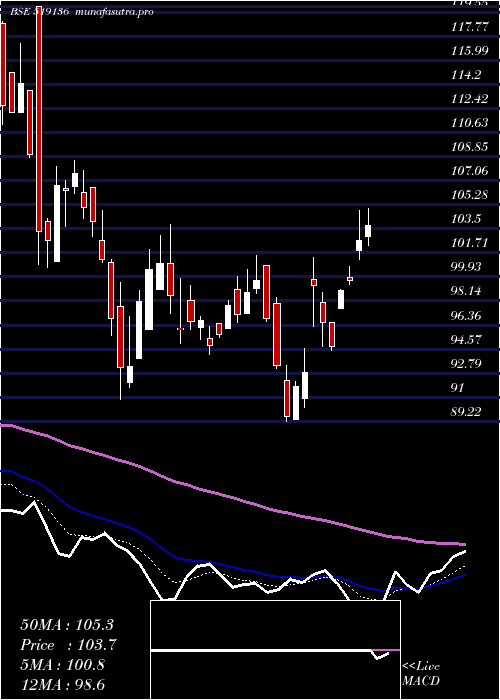
Daily price and volume Nahar Indust
| Date |
Closing |
Open |
Range |
Volume |
Fri 05 December 2025 |
112.05 (1.13%) |
110.50 |
109.00 - 112.30 |
0.4849 times |
Thu 04 December 2025 |
110.80 (-1.47%) |
110.35 |
110.20 - 110.80 |
0.2852 times |
Wed 03 December 2025 |
112.45 (0%) |
112.00 |
110.70 - 112.50 |
0.3001 times |
Tue 02 December 2025 |
112.45 (-2.22%) |
112.40 |
112.40 - 114.10 |
0.2309 times |
Mon 01 December 2025 |
115.00 (-0.26%) |
112.15 |
112.15 - 115.65 |
0.7728 times |
Fri 28 November 2025 |
115.30 (-1.07%) |
115.00 |
114.25 - 115.40 |
2.0549 times |
Thu 27 November 2025 |
116.55 (0.3%) |
115.50 |
115.00 - 117.00 |
0.857 times |
Wed 26 November 2025 |
116.20 (3.75%) |
120.95 |
113.00 - 120.95 |
1.0268 times |
Tue 25 November 2025 |
112.00 (-0.62%) |
112.50 |
112.00 - 112.50 |
0.0448 times |
Mon 24 November 2025 |
112.70 (-1.96%) |
114.95 |
112.30 - 117.00 |
3.9427 times |
Fri 21 November 2025 |
114.95 (0.88%) |
114.10 |
114.00 - 114.95 |
2.5343 times |
Weekly price and charts NaharIndust Strong weekly Stock price targets for NaharIndust 519136 are 107.2 and 113.85 | Weekly Target 1 | 105.58 | | Weekly Target 2 | 108.82 | | Weekly Target 3 | 112.23333333333 | | Weekly Target 4 | 115.47 | | Weekly Target 5 | 118.88 |
Weekly price and volumes for Nahar Indust
| Date |
Closing |
Open |
Range |
Volume |
Fri 05 December 2025 |
112.05 (-2.82%) |
112.15 |
109.00 - 115.65 |
0.3385 times |
Fri 28 November 2025 |
115.30 (0.3%) |
114.95 |
112.00 - 120.95 |
1.2936 times |
Fri 21 November 2025 |
114.95 (4.5%) |
113.55 |
110.20 - 122.00 |
2.9433 times |
Fri 14 November 2025 |
110.00 (-0.09%) |
110.05 |
108.50 - 113.00 |
1.3312 times |
Fri 07 November 2025 |
110.10 (-4.68%) |
112.85 |
109.00 - 126.00 |
0.4362 times |
Fri 31 October 2025 |
115.50 (-0.6%) |
115.05 |
114.30 - 117.80 |
0.6144 times |
Thu 23 October 2025 |
116.20 (1.4%) |
118.90 |
114.40 - 118.90 |
0.0574 times |
Fri 17 October 2025 |
114.60 (-1.21%) |
118.00 |
113.50 - 121.00 |
1.349 times |
Fri 10 October 2025 |
116.00 (-1.61%) |
120.40 |
114.55 - 123.80 |
0.9671 times |
Fri 03 October 2025 |
117.90 (2.39%) |
117.00 |
113.65 - 119.00 |
0.6694 times |
Fri 26 September 2025 |
115.15 (-2.83%) |
122.00 |
114.70 - 129.35 |
5.4007 times |

Monthly price and charts NaharIndust Strong monthly Stock price targets for NaharIndust 519136 are 107.2 and 113.85 | Monthly Target 1 | 105.58 | | Monthly Target 2 | 108.82 | | Monthly Target 3 | 112.23333333333 | | Monthly Target 4 | 115.47 | | Monthly Target 5 | 118.88 |
Monthly price and volumes Nahar Indust
| Date |
Closing |
Open |
Range |
Volume |
Fri 05 December 2025 |
112.05 (-2.82%) |
112.15 |
109.00 - 115.65 |
0.0141 times |
Fri 28 November 2025 |
115.30 (-0.17%) |
112.85 |
108.50 - 126.00 |
0.2493 times |
Fri 31 October 2025 |
115.50 (0.87%) |
116.00 |
113.50 - 123.80 |
0.1401 times |
Tue 30 September 2025 |
114.50 (2.97%) |
113.00 |
106.70 - 129.35 |
0.3639 times |
Fri 29 August 2025 |
111.20 (-8.93%) |
122.10 |
104.10 - 125.00 |
0.1994 times |
Thu 31 July 2025 |
122.10 (-10.81%) |
136.00 |
122.00 - 137.50 |
0.4621 times |
Mon 30 June 2025 |
136.90 (0.15%) |
143.00 |
127.10 - 150.00 |
1.0373 times |
Fri 30 May 2025 |
136.69 (40.79%) |
97.15 |
94.34 - 146.00 |
1.9469 times |
Wed 30 April 2025 |
97.09 (8.43%) |
89.33 |
89.33 - 106.89 |
0.2946 times |
Fri 28 March 2025 |
89.54 (-7.55%) |
97.75 |
89.22 - 103.85 |
5.2925 times |
Fri 28 February 2025 |
96.85 (-21.55%) |
121.50 |
95.55 - 125.85 |
0.3179 times |

DMA SMA EMA moving averages of Nahar Indust 519136
DMA (daily moving average) of Nahar Indust 519136
| DMA period | DMA value | | 5 day DMA | 112.55 | | 12 day DMA | 113.7 | | 20 day DMA | 112.96 | | 35 day DMA | 113.73 | | 50 day DMA | 114.97 | | 100 day DMA | 117.14 | | 150 day DMA | 120.01 | | 200 day DMA | 116.07 | EMA (exponential moving average) of Nahar Indust 519136
| EMA period | EMA current | EMA prev | EMA prev2 | | 5 day EMA | 112.46 | 112.67 | 113.6 | | 12 day EMA | 113.16 | 113.36 | 113.82 | | 20 day EMA | 113.43 | 113.57 | 113.86 | | 35 day EMA | 114.14 | 114.26 | 114.46 | | 50 day EMA | 114.77 | 114.88 | 115.05 |
SMA (simple moving average) of Nahar Indust 519136
| SMA period | SMA current | SMA prev | SMA prev2 | | 5 day SMA | 112.55 | 113.2 | 114.35 | | 12 day SMA | 113.7 | 114.37 | 114.33 | | 20 day SMA | 112.96 | 112.9 | 113 | | 35 day SMA | 113.73 | 113.84 | 113.96 | | 50 day SMA | 114.97 | 115.05 | 115.16 | | 100 day SMA | 117.14 | 117.38 | 117.62 | | 150 day SMA | 120.01 | 119.95 | 119.9 | | 200 day SMA | 116.07 | 116.1 | 116.17 |
|
|
