PrasantInd 519014 full analysis,charts,indicators,moving averages,SMA,DMA,EMA,ADX,MACD,RSIPrasant Ind 519014 WideScreen charts, DMA,SMA,EMA technical analysis, forecast prediction, by indicators ADX,MACD,RSI,CCI BSE stock exchange
Daily price and charts and targets PrasantInd Strong Daily Stock price targets for PrasantInd 519014 are 14.15 and 14.15 | Daily Target 1 | 14.15 | | Daily Target 2 | 14.15 | | Daily Target 3 | 14.15 | | Daily Target 4 | 14.15 | | Daily Target 5 | 14.15 |
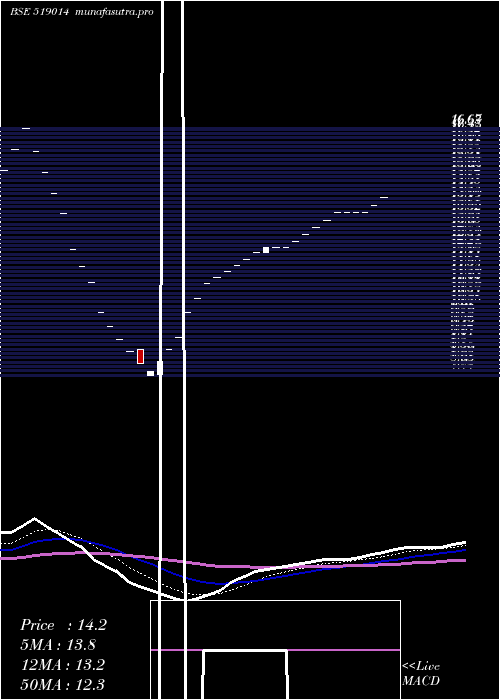
Daily price and volume Prasant Ind
| Date |
Closing |
Open |
Range |
Volume |
| Tue 03 June 2025 |
14.15 (1.95%) |
14.15 |
14.15 - 14.15 |
1.8195 times |
| Mon 02 June 2025 |
13.88 (1.98%) |
13.88 |
13.88 - 13.88 |
0.2426 times |
| Fri 30 May 2025 |
13.61 (0%) |
13.61 |
13.61 - 13.61 |
0.0049 times |
| Tue 27 May 2025 |
13.61 (0%) |
13.61 |
13.61 - 13.61 |
0.2911 times |
| Mon 26 May 2025 |
13.61 (0%) |
13.61 |
13.61 - 13.61 |
0.0485 times |
| Fri 23 May 2025 |
13.61 (1.95%) |
13.61 |
13.61 - 13.61 |
0.6647 times |
| Wed 21 May 2025 |
13.35 (1.99%) |
13.35 |
13.35 - 13.35 |
3.1271 times |
| Tue 20 May 2025 |
13.09 (1.95%) |
13.09 |
13.09 - 13.09 |
2.0087 times |
| Fri 16 May 2025 |
12.84 (1.99%) |
12.84 |
12.84 - 12.84 |
0.9437 times |
| Thu 15 May 2025 |
12.59 (1.94%) |
12.59 |
12.59 - 12.59 |
0.8491 times |
| Wed 14 May 2025 |
12.35 (0%) |
12.35 |
12.35 - 12.35 |
0.017 times |
Weekly price and charts PrasantInd Strong weekly Stock price targets for PrasantInd 519014 are 14.02 and 14.29 | Weekly Target 1 | 13.79 | | Weekly Target 2 | 13.97 | | Weekly Target 3 | 14.06 | | Weekly Target 4 | 14.24 | | Weekly Target 5 | 14.33 |
Weekly price and volumes for Prasant Ind
| Date |
Closing |
Open |
Range |
Volume |
| Tue 03 June 2025 |
14.15 (3.97%) |
13.88 |
13.88 - 14.15 |
0.6901 times |
| Fri 30 May 2025 |
13.61 (0%) |
13.61 |
13.61 - 13.61 |
0.1153 times |
| Fri 23 May 2025 |
13.61 (6%) |
13.09 |
13.09 - 13.61 |
1.9412 times |
| Fri 16 May 2025 |
12.84 (5.51%) |
12.17 |
12.17 - 12.84 |
2.1093 times |
| Fri 09 May 2025 |
12.17 (5.92%) |
11.71 |
11.71 - 12.17 |
0.3662 times |
| Fri 02 May 2025 |
11.49 (14.56%) |
10.53 |
10.53 - 11.49 |
1.3575 times |
| Fri 25 April 2025 |
10.03 (21.28%) |
8.68 |
8.68 - 10.03 |
0.3605 times |
| Thu 17 April 2025 |
8.27 (-3.84%) |
8.68 |
7.77 - 8.68 |
0.6649 times |
| Fri 11 April 2025 |
8.60 (-14.17%) |
9.52 |
8.60 - 9.52 |
2.0297 times |
| Fri 04 April 2025 |
10.02 (-18.4%) |
11.67 |
10.02 - 11.67 |
0.3653 times |
| Fri 28 March 2025 |
12.28 (-22.47%) |
15.05 |
12.28 - 15.05 |
0.4741 times |

Monthly price and charts PrasantInd Strong monthly Stock price targets for PrasantInd 519014 are 14.02 and 14.29 | Monthly Target 1 | 13.79 | | Monthly Target 2 | 13.97 | | Monthly Target 3 | 14.06 | | Monthly Target 4 | 14.24 | | Monthly Target 5 | 14.33 |
Monthly price and volumes Prasant Ind
| Date |
Closing |
Open |
Range |
Volume |
| Tue 03 June 2025 |
14.15 (3.97%) |
13.88 |
13.88 - 14.15 |
0.1472 times |
| Fri 30 May 2025 |
13.61 (20.76%) |
11.49 |
11.49 - 13.61 |
1.0692 times |
| Wed 30 April 2025 |
11.27 (-8.22%) |
11.67 |
7.77 - 11.67 |
0.9173 times |
| Fri 28 March 2025 |
12.28 (-18.41%) |
14.30 |
12.28 - 14.30 |
0.0977 times |
| Mon 17 February 2025 |
15.05 (-9.72%) |
15.84 |
15.05 - 15.84 |
0.0043 times |
| Wed 29 January 2025 |
16.67 (62.16%) |
9.77 |
9.77 - 16.67 |
2.1703 times |
| Tue 31 December 2024 |
10.28 (-14.26%) |
11.99 |
10.28 - 11.99 |
0.157 times |
| Tue 26 November 2024 |
11.99 (-12.86%) |
14.44 |
11.99 - 14.44 |
0.3054 times |
| Wed 30 October 2024 |
13.76 (14.67%) |
11.99 |
8.95 - 13.76 |
1.6417 times |
| Mon 30 September 2024 |
12.00 (-16.38%) |
14.35 |
11.37 - 14.74 |
3.4898 times |
| Fri 30 August 2024 |
14.35 (4.59%) |
13.04 |
11.74 - 14.78 |
1.7653 times |

DMA SMA EMA moving averages of Prasant Ind 519014
DMA (daily moving average) of Prasant Ind 519014
| DMA period | DMA value | | 5 day DMA | 13.77 | | 12 day DMA | 13.25 | | 20 day DMA | 12.58 | | 35 day DMA | 11.54 | | 50 day DMA | 12.27 | | 100 day DMA | 12.13 | | 150 day DMA | 12.59 | | 200 day DMA | 12.56 | EMA (exponential moving average) of Prasant Ind 519014
| EMA period | EMA current | EMA prev | EMA prev2 | | 5 day EMA | 13.79 | 13.61 | 13.47 | | 12 day EMA | 13.24 | 13.07 | 12.92 | | 20 day EMA | 12.74 | 12.59 | 12.45 | | 35 day EMA | 12.61 | 12.52 | 12.44 | | 50 day EMA | 12.36 | 12.29 | 12.23 |
SMA (simple moving average) of Prasant Ind 519014
| SMA period | SMA current | SMA prev | SMA prev2 | | 5 day SMA | 13.77 | 13.66 | 13.56 | | 12 day SMA | 13.25 | 13.1 | 12.96 | | 20 day SMA | 12.58 | 12.37 | 12.13 | | 35 day SMA | 11.54 | 11.56 | 11.62 | | 50 day SMA | 12.27 | 12.24 | 12.2 | | 100 day SMA | 12.13 | 12.1 | 12.08 | | 150 day SMA | 12.59 | 12.57 | 12.56 | | 200 day SMA | 12.56 | 12.55 | 12.55 |
|
|
