OnwardTechn 517536 full analysis,charts,indicators,moving averages,SMA,DMA,EMA,ADX,MACD,RSIOnward Techn 517536 WideScreen charts, DMA,SMA,EMA technical analysis, forecast prediction, by indicators ADX,MACD,RSI,CCI BSE stock exchange
Daily price and charts and targets OnwardTechn Strong Daily Stock price targets for OnwardTechn 517536 are 314.18 and 321.93 | Daily Target 1 | 308.22 | | Daily Target 2 | 312.38 | | Daily Target 3 | 315.96666666667 | | Daily Target 4 | 320.13 | | Daily Target 5 | 323.72 |
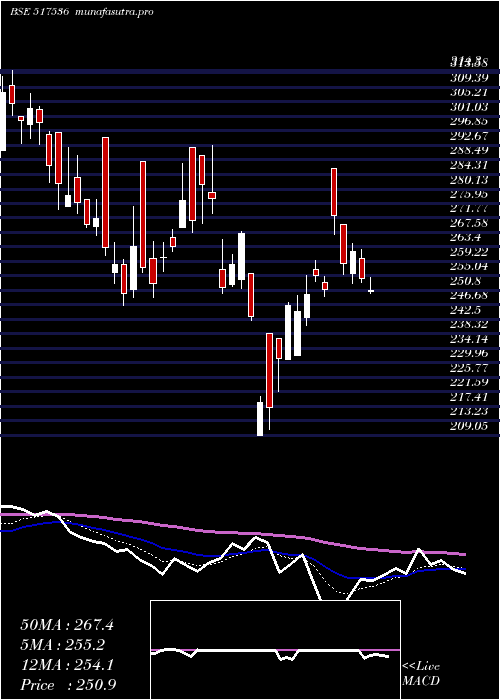
Daily price and volume Onward Techn
| Date |
Closing |
Open |
Range |
Volume |
Tue 21 October 2025 |
316.55 (2.66%) |
313.70 |
311.80 - 319.55 |
0.2514 times |
Mon 20 October 2025 |
308.35 (0.36%) |
310.95 |
304.05 - 318.45 |
0.5008 times |
Fri 17 October 2025 |
307.25 (-1.73%) |
317.70 |
300.75 - 334.30 |
5.3371 times |
Thu 16 October 2025 |
312.65 (-0.29%) |
315.90 |
311.05 - 321.00 |
0.3135 times |
Wed 15 October 2025 |
313.55 (2%) |
308.50 |
308.10 - 319.60 |
0.4848 times |
Tue 14 October 2025 |
307.40 (0.13%) |
312.50 |
306.25 - 315.60 |
0.5076 times |
Mon 13 October 2025 |
307.00 (-2.45%) |
308.35 |
303.05 - 313.70 |
0.4948 times |
Fri 10 October 2025 |
314.70 (3.55%) |
303.50 |
303.50 - 320.30 |
1.3865 times |
Thu 09 October 2025 |
303.90 (-3.69%) |
305.00 |
302.15 - 318.60 |
0.4367 times |
Wed 08 October 2025 |
315.55 (-1.56%) |
317.75 |
315.15 - 323.95 |
0.2868 times |
Tue 07 October 2025 |
320.55 (-0.03%) |
319.00 |
313.80 - 334.95 |
2.2859 times |
Weekly price and charts OnwardTechn Strong weekly Stock price targets for OnwardTechn 517536 are 310.3 and 325.8 | Weekly Target 1 | 297.88 | | Weekly Target 2 | 307.22 | | Weekly Target 3 | 313.38333333333 | | Weekly Target 4 | 322.72 | | Weekly Target 5 | 328.88 |
Weekly price and volumes for Onward Techn
| Date |
Closing |
Open |
Range |
Volume |
Tue 21 October 2025 |
316.55 (3.03%) |
310.95 |
304.05 - 319.55 |
0.2203 times |
Fri 17 October 2025 |
307.25 (-2.37%) |
308.35 |
300.75 - 334.30 |
2.0908 times |
Fri 10 October 2025 |
314.70 (5.96%) |
301.15 |
301.15 - 348.00 |
4.1589 times |
Fri 03 October 2025 |
297.00 (2.13%) |
292.55 |
285.50 - 298.50 |
0.169 times |
Fri 26 September 2025 |
290.80 (-8.88%) |
313.05 |
286.00 - 319.75 |
1.0608 times |
Fri 19 September 2025 |
319.15 (0.05%) |
315.40 |
305.00 - 323.50 |
0.6684 times |
Fri 12 September 2025 |
319.00 (-6.97%) |
328.50 |
312.70 - 340.00 |
0.4929 times |
Fri 05 September 2025 |
342.90 (1.74%) |
333.95 |
324.20 - 349.80 |
0.3771 times |
Fri 29 August 2025 |
337.05 (-1.3%) |
331.70 |
306.50 - 344.95 |
0.4495 times |
Fri 22 August 2025 |
341.50 (7.73%) |
310.75 |
310.75 - 341.70 |
0.3122 times |
Thu 14 August 2025 |
317.00 (-2.58%) |
318.90 |
306.40 - 318.90 |
0.1989 times |

Monthly price and charts OnwardTechn Strong monthly Stock price targets for OnwardTechn 517536 are 301.78 and 362.78 | Monthly Target 1 | 256.18 | | Monthly Target 2 | 286.37 | | Monthly Target 3 | 317.18333333333 | | Monthly Target 4 | 347.37 | | Monthly Target 5 | 378.18 |
Monthly price and volumes Onward Techn
| Date |
Closing |
Open |
Range |
Volume |
Tue 21 October 2025 |
316.55 (10.32%) |
287.00 |
287.00 - 348.00 |
0.8755 times |
Tue 30 September 2025 |
286.95 (-14.86%) |
333.95 |
285.50 - 349.80 |
0.3492 times |
Fri 29 August 2025 |
337.05 (1.81%) |
337.65 |
306.40 - 344.95 |
0.1516 times |
Thu 31 July 2025 |
331.05 (-4.69%) |
350.80 |
310.50 - 382.00 |
0.7032 times |
Mon 30 June 2025 |
347.35 (16.85%) |
295.25 |
291.50 - 377.05 |
2.3978 times |
Fri 30 May 2025 |
297.25 (18.5%) |
254.20 |
215.05 - 325.60 |
1.4737 times |
Wed 30 April 2025 |
250.85 (-0.32%) |
252.70 |
209.05 - 286.00 |
0.3479 times |
Fri 28 March 2025 |
251.65 (-12.24%) |
296.30 |
246.55 - 296.30 |
1.6087 times |
Fri 28 February 2025 |
286.75 (11.12%) |
263.10 |
253.00 - 317.60 |
0.936 times |
Fri 31 January 2025 |
258.05 (-17.96%) |
315.40 |
250.00 - 345.00 |
1.1564 times |
Tue 31 December 2024 |
314.55 (-3.84%) |
328.05 |
312.60 - 357.55 |
0.4803 times |

DMA SMA EMA moving averages of Onward Techn 517536
DMA (daily moving average) of Onward Techn 517536
| DMA period | DMA value | | 5 day DMA | 311.67 | | 12 day DMA | 312.34 | | 20 day DMA | 305.63 | | 35 day DMA | 312.66 | | 50 day DMA | 316.42 | | 100 day DMA | 322.56 | | 150 day DMA | 302.36 | | 200 day DMA | 300.86 | EMA (exponential moving average) of Onward Techn 517536
| EMA period | EMA current | EMA prev | EMA prev2 | | 5 day EMA | 311.75 | 309.35 | 309.85 | | 12 day EMA | 310.14 | 308.98 | 309.1 | | 20 day EMA | 310.17 | 309.5 | 309.62 | | 35 day EMA | 313.02 | 312.81 | 313.07 | | 50 day EMA | 317.33 | 317.36 | 317.73 |
SMA (simple moving average) of Onward Techn 517536
| SMA period | SMA current | SMA prev | SMA prev2 | | 5 day SMA | 311.67 | 309.84 | 309.57 | | 12 day SMA | 312.34 | 310.71 | 309.69 | | 20 day SMA | 305.63 | 305.29 | 305.83 | | 35 day SMA | 312.66 | 313.14 | 313.96 | | 50 day SMA | 316.42 | 316.72 | 317.07 | | 100 day SMA | 322.56 | 322.36 | 322.3 | | 150 day SMA | 302.36 | 302.09 | 301.89 | | 200 day SMA | 300.86 | 300.88 | 300.92 |
|
|
