Dhindia 517514 full analysis,charts,indicators,moving averages,SMA,DMA,EMA,ADX,MACD,RSIDhindia 517514 WideScreen charts, DMA,SMA,EMA technical analysis, forecast prediction, by indicators ADX,MACD,RSI,CCI BSE stock exchange
Daily price and charts and targets Dhindia Strong Daily Stock price targets for Dhindia 517514 are 154.18 and 169.13 | Daily Target 1 | 151.47 | | Daily Target 2 | 156.88 | | Daily Target 3 | 166.41666666667 | | Daily Target 4 | 171.83 | | Daily Target 5 | 181.37 |
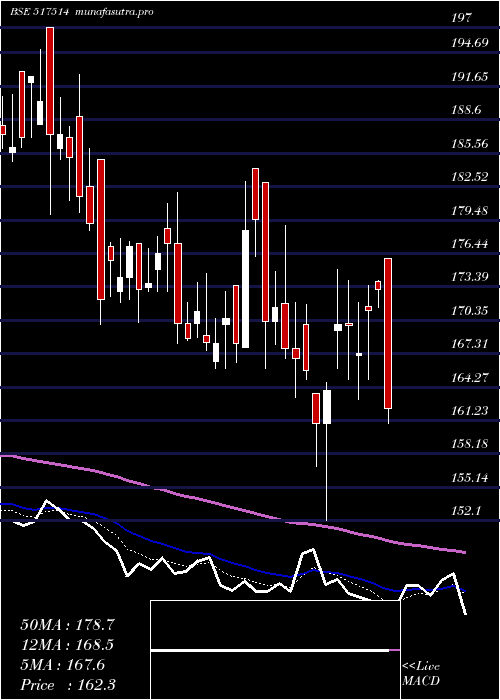
Daily price and volume Dhindia
| Date |
Closing |
Open |
Range |
Volume |
Thu 23 October 2025 |
162.30 (-6.27%) |
175.95 |
161.00 - 175.95 |
2.7528 times |
Tue 21 October 2025 |
173.15 (1.14%) |
173.90 |
171.50 - 174.00 |
0.1139 times |
Mon 20 October 2025 |
171.20 (2.3%) |
171.60 |
165.00 - 173.50 |
0.4779 times |
Fri 17 October 2025 |
167.35 (-1.47%) |
167.15 |
163.10 - 172.00 |
0.3401 times |
Thu 16 October 2025 |
169.85 (-0.09%) |
170.05 |
165.00 - 174.00 |
1.7163 times |
Wed 15 October 2025 |
170.00 (3.69%) |
169.40 |
166.00 - 175.00 |
1.0078 times |
Tue 14 October 2025 |
163.95 (1.83%) |
161.00 |
152.10 - 164.70 |
1.5686 times |
Mon 13 October 2025 |
161.00 (-2.9%) |
163.65 |
157.00 - 163.65 |
0.7966 times |
Fri 10 October 2025 |
165.80 (-0.63%) |
169.95 |
165.00 - 171.80 |
0.3789 times |
Thu 09 October 2025 |
166.85 (-0.57%) |
167.80 |
163.35 - 172.00 |
0.847 times |
Wed 08 October 2025 |
167.80 (-2.19%) |
171.90 |
166.90 - 179.00 |
1.9437 times |
Weekly price and charts Dhindia Strong weekly Stock price targets for Dhindia 517514 are 154.18 and 169.13 | Weekly Target 1 | 151.47 | | Weekly Target 2 | 156.88 | | Weekly Target 3 | 166.41666666667 | | Weekly Target 4 | 171.83 | | Weekly Target 5 | 181.37 |
Weekly price and volumes for Dhindia
| Date |
Closing |
Open |
Range |
Volume |
Thu 23 October 2025 |
162.30 (-3.02%) |
171.60 |
161.00 - 175.95 |
1.0886 times |
Fri 17 October 2025 |
167.35 (0.93%) |
163.65 |
152.10 - 175.00 |
1.7672 times |
Fri 10 October 2025 |
165.80 (-7.63%) |
182.90 |
163.35 - 182.90 |
1.3292 times |
Fri 03 October 2025 |
179.50 (6.69%) |
169.95 |
166.00 - 184.20 |
1.6236 times |
Fri 26 September 2025 |
168.25 (-5.1%) |
177.30 |
166.00 - 182.00 |
0.9488 times |
Fri 19 September 2025 |
177.30 (1.75%) |
174.25 |
170.20 - 181.00 |
0.4665 times |
Fri 12 September 2025 |
174.25 (-5.89%) |
188.90 |
170.00 - 192.70 |
1.0638 times |
Fri 05 September 2025 |
185.15 (-0.99%) |
192.00 |
180.00 - 197.00 |
0.5955 times |
Fri 29 August 2025 |
187.00 (-3.86%) |
192.55 |
184.85 - 196.95 |
0.3221 times |
Fri 22 August 2025 |
194.50 (0.57%) |
190.00 |
180.00 - 200.00 |
0.7948 times |
Thu 14 August 2025 |
193.40 (2.95%) |
191.65 |
187.00 - 201.40 |
0.5704 times |

Monthly price and charts Dhindia Strong monthly Stock price targets for Dhindia 517514 are 141.15 and 173.25 | Monthly Target 1 | 134.1 | | Monthly Target 2 | 148.2 | | Monthly Target 3 | 166.2 | | Monthly Target 4 | 180.3 | | Monthly Target 5 | 198.3 |
Monthly price and volumes Dhindia
| Date |
Closing |
Open |
Range |
Volume |
Thu 23 October 2025 |
162.30 (-3.54%) |
167.90 |
152.10 - 184.20 |
0.7379 times |
Tue 30 September 2025 |
168.25 (-10.03%) |
192.00 |
166.00 - 197.00 |
0.7336 times |
Fri 29 August 2025 |
187.00 (2.89%) |
180.40 |
171.55 - 201.40 |
0.5958 times |
Thu 31 July 2025 |
181.75 (-20.75%) |
230.00 |
171.00 - 270.50 |
2.0609 times |
Mon 30 June 2025 |
229.35 (5.62%) |
218.20 |
215.20 - 245.00 |
0.4579 times |
Fri 30 May 2025 |
217.15 (7.98%) |
204.90 |
187.00 - 228.00 |
0.5075 times |
Wed 30 April 2025 |
201.10 (-0.07%) |
204.50 |
198.10 - 234.95 |
0.3295 times |
Fri 28 March 2025 |
201.25 (-0.1%) |
204.00 |
180.50 - 239.70 |
0.6421 times |
Fri 28 February 2025 |
201.45 (-20.72%) |
262.80 |
194.80 - 262.80 |
0.8741 times |
Fri 31 January 2025 |
254.10 (52.34%) |
164.00 |
158.50 - 269.10 |
3.0608 times |
Tue 31 December 2024 |
166.80 (14.32%) |
147.20 |
145.25 - 199.00 |
2.1404 times |

DMA SMA EMA moving averages of Dhindia 517514
DMA (daily moving average) of Dhindia 517514
| DMA period | DMA value | | 5 day DMA | 168.77 | | 12 day DMA | 167.57 | | 20 day DMA | 169.28 | | 35 day DMA | 172.7 | | 50 day DMA | 178.14 | | 100 day DMA | 198.97 | | 150 day DMA | 201.92 | | 200 day DMA | 203.35 | EMA (exponential moving average) of Dhindia 517514
| EMA period | EMA current | EMA prev | EMA prev2 | | 5 day EMA | 167.62 | 170.28 | 168.85 | | 12 day EMA | 168.49 | 169.61 | 168.97 | | 20 day EMA | 169.93 | 170.73 | 170.47 | | 35 day EMA | 173.84 | 174.52 | 174.6 | | 50 day EMA | 177.97 | 178.61 | 178.83 |
SMA (simple moving average) of Dhindia 517514
| SMA period | SMA current | SMA prev | SMA prev2 | | 5 day SMA | 168.77 | 170.31 | 168.47 | | 12 day SMA | 167.57 | 168.23 | 168.76 | | 20 day SMA | 169.28 | 169.6 | 169.45 | | 35 day SMA | 172.7 | 173.5 | 174.06 | | 50 day SMA | 178.14 | 178.65 | 179.09 | | 100 day SMA | 198.97 | 199.42 | 199.79 | | 150 day SMA | 201.92 | 202.15 | 202.32 | | 200 day SMA | 203.35 | 203.46 | 203.54 |
|
|
