Marsons 517467 full analysis,charts,indicators,moving averages,SMA,DMA,EMA,ADX,MACD,RSIMarsons 517467 WideScreen charts, DMA,SMA,EMA technical analysis, forecast prediction, by indicators ADX,MACD,RSI,CCI BSE stock exchange
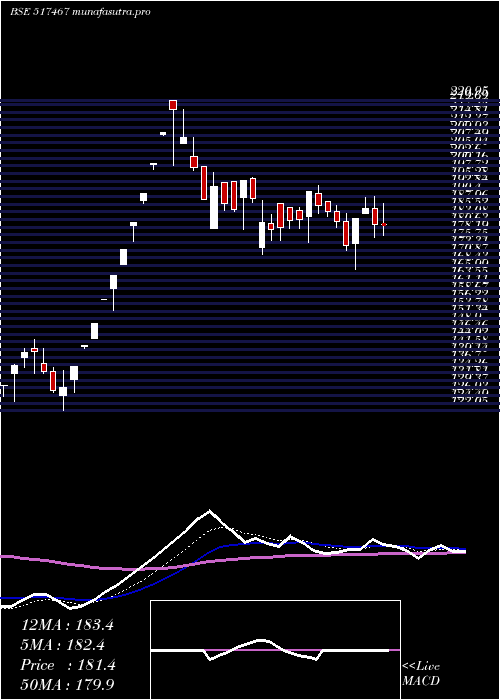
Daily price and charts and targets Marsons Strong Daily Stock price targets for Marsons 517467 are 173.9 and 178.05 | Daily Target 1 | 173.08 | | Daily Target 2 | 174.72 | | Daily Target 3 | 177.23333333333 | | Daily Target 4 | 178.87 | | Daily Target 5 | 181.38 |
Daily price and volume Marsons
| Date |
Closing |
Open |
Range |
Volume |
Tue 21 October 2025 |
176.35 (0.4%) |
176.90 |
175.60 - 179.75 |
0.1695 times |
Mon 20 October 2025 |
175.65 (0.11%) |
178.00 |
174.45 - 178.00 |
0.4878 times |
Fri 17 October 2025 |
175.45 (-1.24%) |
176.00 |
174.05 - 178.85 |
1.245 times |
Thu 16 October 2025 |
177.65 (0.62%) |
176.55 |
176.00 - 179.80 |
0.6811 times |
Wed 15 October 2025 |
176.55 (-0.87%) |
177.50 |
176.00 - 180.00 |
0.7778 times |
Tue 14 October 2025 |
178.10 (-1.06%) |
181.40 |
176.60 - 181.40 |
0.8698 times |
Mon 13 October 2025 |
180.00 (-0.88%) |
180.00 |
177.80 - 182.95 |
0.7679 times |
Fri 10 October 2025 |
181.60 (0.55%) |
181.60 |
174.50 - 182.50 |
3.4621 times |
Thu 09 October 2025 |
180.60 (-0.14%) |
188.45 |
178.25 - 188.45 |
1.2199 times |
Wed 08 October 2025 |
180.85 (-1.44%) |
185.00 |
180.00 - 185.95 |
0.319 times |
Tue 07 October 2025 |
183.50 (2.57%) |
178.50 |
176.25 - 185.25 |
2.8035 times |
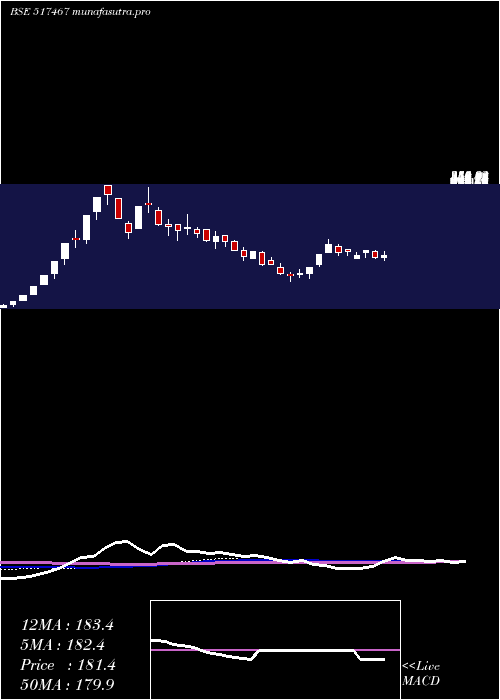
Weekly price and charts Marsons Strong weekly Stock price targets for Marsons 517467 are 172.75 and 178.05 | Weekly Target 1 | 171.55 | | Weekly Target 2 | 173.95 | | Weekly Target 3 | 176.85 | | Weekly Target 4 | 179.25 | | Weekly Target 5 | 182.15 |
Weekly price and volumes for Marsons
| Date |
Closing |
Open |
Range |
Volume |
Tue 21 October 2025 |
176.35 (0.51%) |
178.00 |
174.45 - 179.75 |
0.1351 times |
Fri 17 October 2025 |
175.45 (-3.39%) |
180.00 |
174.05 - 182.95 |
0.8926 times |
Fri 10 October 2025 |
181.60 (3.15%) |
175.10 |
172.25 - 188.45 |
2.0101 times |
Fri 03 October 2025 |
176.05 (-0.06%) |
177.95 |
171.05 - 182.40 |
0.5822 times |
Fri 26 September 2025 |
176.15 (-1.84%) |
179.85 |
174.00 - 181.00 |
0.5479 times |
Fri 19 September 2025 |
179.45 (-2.47%) |
183.10 |
175.00 - 185.85 |
0.543 times |
Fri 12 September 2025 |
184.00 (-5.4%) |
194.50 |
183.05 - 196.00 |
1.2228 times |
Fri 05 September 2025 |
194.50 (3.29%) |
189.75 |
180.55 - 200.05 |
1.8507 times |
Fri 29 August 2025 |
188.30 (1.56%) |
188.00 |
175.50 - 198.90 |
0.7751 times |
Fri 22 August 2025 |
185.40 (-4.26%) |
195.50 |
181.55 - 195.95 |
1.4405 times |
Thu 14 August 2025 |
193.65 (2.7%) |
190.90 |
177.10 - 202.10 |
1.4289 times |
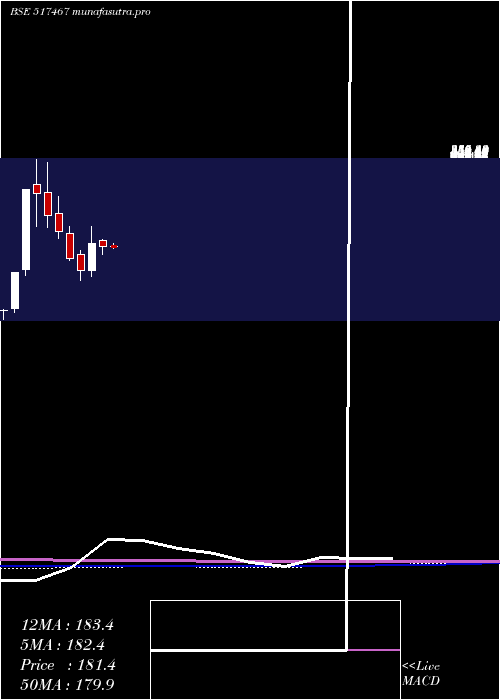
Monthly price and charts Marsons Strong monthly Stock price targets for Marsons 517467 are 166.2 and 182.4 | Monthly Target 1 | 162.82 | | Monthly Target 2 | 169.58 | | Monthly Target 3 | 179.01666666667 | | Monthly Target 4 | 185.78 | | Monthly Target 5 | 195.22 |
Monthly price and volumes Marsons
| Date |
Closing |
Open |
Range |
Volume |
Tue 21 October 2025 |
176.35 (-2.76%) |
178.25 |
172.25 - 188.45 |
0.6065 times |
Tue 30 September 2025 |
181.35 (-3.69%) |
189.75 |
171.05 - 200.05 |
0.8691 times |
Fri 29 August 2025 |
188.30 (-6.01%) |
202.95 |
175.50 - 202.95 |
0.7718 times |
Thu 31 July 2025 |
200.35 (-10.4%) |
220.80 |
181.00 - 231.50 |
0.743 times |
Mon 30 June 2025 |
223.60 (9.37%) |
204.95 |
187.00 - 225.55 |
1.6095 times |
Fri 30 May 2025 |
204.45 (12.68%) |
181.50 |
170.70 - 210.00 |
1.1915 times |
Wed 30 April 2025 |
181.45 (-3.61%) |
195.00 |
167.00 - 196.50 |
0.4916 times |
Fri 28 March 2025 |
188.25 (39.81%) |
134.70 |
122.05 - 220.95 |
1.7574 times |
Fri 28 February 2025 |
134.65 (-15.47%) |
167.25 |
115.00 - 175.00 |
1.3127 times |
Fri 31 January 2025 |
159.30 (-25.05%) |
208.00 |
154.65 - 222.00 |
0.6469 times |
Tue 31 December 2024 |
212.55 (-12.89%) |
246.90 |
198.00 - 281.50 |
1.3438 times |
DMA SMA EMA moving averages of Marsons 517467
DMA (daily moving average) of Marsons 517467
| DMA period | DMA value | | 5 day DMA | 176.33 | | 12 day DMA | 178.77 | | 20 day DMA | 178.4 | | 35 day DMA | 181.68 | | 50 day DMA | 183.9 | | 100 day DMA | 193.52 | | 150 day DMA | 191.32 | | 200 day DMA | 186.21 | EMA (exponential moving average) of Marsons 517467
| EMA period | EMA current | EMA prev | EMA prev2 | | 5 day EMA | 176.64 | 176.79 | 177.36 | | 12 day EMA | 177.85 | 178.12 | 178.57 | | 20 day EMA | 179.02 | 179.3 | 179.68 | | 35 day EMA | 181.39 | 181.69 | 182.05 | | 50 day EMA | 183.82 | 184.12 | 184.47 |
SMA (simple moving average) of Marsons 517467
| SMA period | SMA current | SMA prev | SMA prev2 | | 5 day SMA | 176.33 | 176.68 | 177.55 | | 12 day SMA | 178.77 | 178.74 | 178.98 | | 20 day SMA | 178.4 | 178.57 | 178.76 | | 35 day SMA | 181.68 | 182.14 | 182.5 | | 50 day SMA | 183.9 | 184.19 | 184.5 | | 100 day SMA | 193.52 | 193.7 | 193.92 | | 150 day SMA | 191.32 | 191.05 | 190.74 | | 200 day SMA | 186.21 | 186.37 | 186.58 |
|
|
