Bflygandhi 517421 full analysis,charts,indicators,moving averages,SMA,DMA,EMA,ADX,MACD,RSIBflygandhi 517421 WideScreen charts, DMA,SMA,EMA technical analysis, forecast prediction, by indicators ADX,MACD,RSI,CCI BSE stock exchange
Daily price and charts and targets Bflygandhi Strong Daily Stock price targets for Bflygandhi 517421 are 702.83 and 713.48 | Daily Target 1 | 701.05 | | Daily Target 2 | 704.6 | | Daily Target 3 | 711.7 | | Daily Target 4 | 715.25 | | Daily Target 5 | 722.35 |
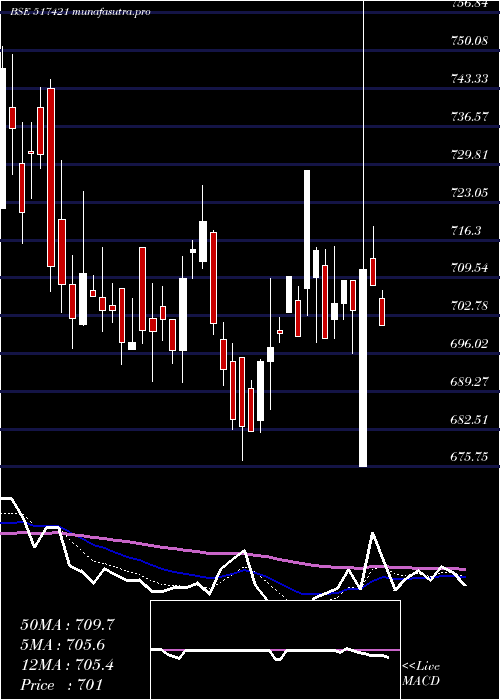
Daily price and volume Bflygandhi
| Date |
Closing |
Open |
Range |
Volume |
Tue 21 October 2025 |
708.15 (-0.4%) |
713.00 |
708.15 - 718.80 |
0.0391 times |
Mon 20 October 2025 |
711.00 (1.02%) |
675.75 |
675.75 - 772.00 |
5.852 times |
Fri 17 October 2025 |
703.80 (-0.75%) |
709.10 |
696.00 - 709.10 |
2.1451 times |
Thu 16 October 2025 |
709.10 (0.58%) |
705.00 |
702.15 - 709.10 |
0.0711 times |
Wed 15 October 2025 |
705.00 (0.91%) |
702.15 |
698.65 - 715.20 |
0.3664 times |
Tue 14 October 2025 |
698.65 (-2.2%) |
711.70 |
698.65 - 714.55 |
0.4411 times |
Mon 13 October 2025 |
714.35 (-1.97%) |
709.55 |
698.10 - 715.00 |
0.4874 times |
Fri 10 October 2025 |
728.70 (4.23%) |
707.65 |
702.80 - 728.70 |
0.0676 times |
Thu 09 October 2025 |
699.10 (-1.49%) |
705.50 |
699.10 - 707.90 |
0.5194 times |
Wed 08 October 2025 |
709.70 (1.44%) |
703.45 |
703.45 - 709.70 |
0.0107 times |
Tue 07 October 2025 |
699.65 (0.36%) |
700.10 |
698.10 - 702.50 |
0.7791 times |
Weekly price and charts Bflygandhi Strong weekly Stock price targets for Bflygandhi 517421 are 691.95 and 788.2 | Weekly Target 1 | 622.38 | | Weekly Target 2 | 665.27 | | Weekly Target 3 | 718.63333333333 | | Weekly Target 4 | 761.52 | | Weekly Target 5 | 814.88 |
Weekly price and volumes for Bflygandhi
| Date |
Closing |
Open |
Range |
Volume |
Tue 21 October 2025 |
708.15 (0.62%) |
675.75 |
675.75 - 772.00 |
0.5806 times |
Fri 17 October 2025 |
703.80 (-3.42%) |
709.55 |
696.00 - 715.20 |
0.346 times |
Fri 10 October 2025 |
728.70 (4.91%) |
694.60 |
686.00 - 728.70 |
0.3832 times |
Fri 03 October 2025 |
694.60 (0.21%) |
694.60 |
677.00 - 697.80 |
0.2514 times |
Fri 26 September 2025 |
693.15 (-0.48%) |
696.50 |
690.25 - 726.00 |
1.8547 times |
Fri 19 September 2025 |
696.50 (-0.21%) |
696.70 |
691.00 - 714.90 |
1.4897 times |
Fri 12 September 2025 |
698.00 (-0.62%) |
701.30 |
694.00 - 725.00 |
1.3211 times |
Fri 05 September 2025 |
702.35 (-2.61%) |
732.10 |
697.00 - 745.00 |
2.2768 times |
Thu 28 August 2025 |
721.15 (-1.92%) |
722.00 |
715.70 - 750.95 |
0.5207 times |
Fri 22 August 2025 |
735.25 (2.43%) |
724.40 |
720.20 - 756.35 |
0.9757 times |
Thu 14 August 2025 |
717.80 (1.71%) |
700.00 |
700.00 - 737.15 |
1.4715 times |

Monthly price and charts Bflygandhi Strong monthly Stock price targets for Bflygandhi 517421 are 691.95 and 788.2 | Monthly Target 1 | 622.38 | | Monthly Target 2 | 665.27 | | Monthly Target 3 | 718.63333333333 | | Monthly Target 4 | 761.52 | | Monthly Target 5 | 814.88 |
Monthly price and volumes Bflygandhi
| Date |
Closing |
Open |
Range |
Volume |
Tue 21 October 2025 |
708.15 (3.68%) |
689.75 |
675.75 - 772.00 |
0.1348 times |
Tue 30 September 2025 |
683.00 (-5.29%) |
732.10 |
677.00 - 745.00 |
0.6589 times |
Thu 28 August 2025 |
721.15 (0.8%) |
720.05 |
645.00 - 795.20 |
2.2729 times |
Thu 31 July 2025 |
715.40 (-1.53%) |
735.45 |
695.00 - 798.00 |
1.0481 times |
Mon 30 June 2025 |
726.50 (-5.39%) |
769.10 |
697.00 - 799.65 |
0.7842 times |
Fri 30 May 2025 |
767.85 (22.52%) |
641.95 |
596.80 - 824.05 |
2.842 times |
Wed 30 April 2025 |
626.70 (4.17%) |
607.75 |
583.95 - 725.15 |
0.7952 times |
Fri 28 March 2025 |
601.60 (2.49%) |
597.90 |
550.55 - 703.00 |
0.4686 times |
Fri 28 February 2025 |
587.00 (-5.21%) |
641.65 |
550.05 - 725.85 |
0.6961 times |
Fri 31 January 2025 |
619.25 (-22.48%) |
854.95 |
610.05 - 854.95 |
0.2992 times |
Tue 31 December 2024 |
798.85 (-2.39%) |
810.00 |
779.55 - 950.00 |
3.1449 times |

DMA SMA EMA moving averages of Bflygandhi 517421
DMA (daily moving average) of Bflygandhi 517421
| DMA period | DMA value | | 5 day DMA | 707.41 | | 12 day DMA | 707.03 | | 20 day DMA | 702.86 | | 35 day DMA | 703.98 | | 50 day DMA | 711.26 | | 100 day DMA | 724.73 | | 150 day DMA | 697.32 | | 200 day DMA | 694.79 | EMA (exponential moving average) of Bflygandhi 517421
| EMA period | EMA current | EMA prev | EMA prev2 | | 5 day EMA | 707.86 | 707.71 | 706.07 | | 12 day EMA | 706.15 | 705.79 | 704.84 | | 20 day EMA | 705.53 | 705.25 | 704.65 | | 35 day EMA | 708.56 | 708.58 | 708.44 | | 50 day EMA | 712.09 | 712.25 | 712.3 |
SMA (simple moving average) of Bflygandhi 517421
| SMA period | SMA current | SMA prev | SMA prev2 | | 5 day SMA | 707.41 | 705.51 | 706.18 | | 12 day SMA | 707.03 | 705.9 | 703.49 | | 20 day SMA | 702.86 | 702.93 | 702.2 | | 35 day SMA | 703.98 | 704.66 | 704.95 | | 50 day SMA | 711.26 | 712.08 | 712.69 | | 100 day SMA | 724.73 | 725.33 | 725.99 | | 150 day SMA | 697.32 | 696.37 | 695.38 | | 200 day SMA | 694.79 | 695.24 | 695.68 |
|
|
