SbecSystems 517360 full analysis,charts,indicators,moving averages,SMA,DMA,EMA,ADX,MACD,RSISbec Systems 517360 WideScreen charts, DMA,SMA,EMA technical analysis, forecast prediction, by indicators ADX,MACD,RSI,CCI BSE stock exchange
Daily price and charts and targets SbecSystems Strong Daily Stock price targets for SbecSystems 517360 are 22.3 and 24.2 | Daily Target 1 | 20.8 | | Daily Target 2 | 21.9 | | Daily Target 3 | 22.7 | | Daily Target 4 | 23.8 | | Daily Target 5 | 24.6 |
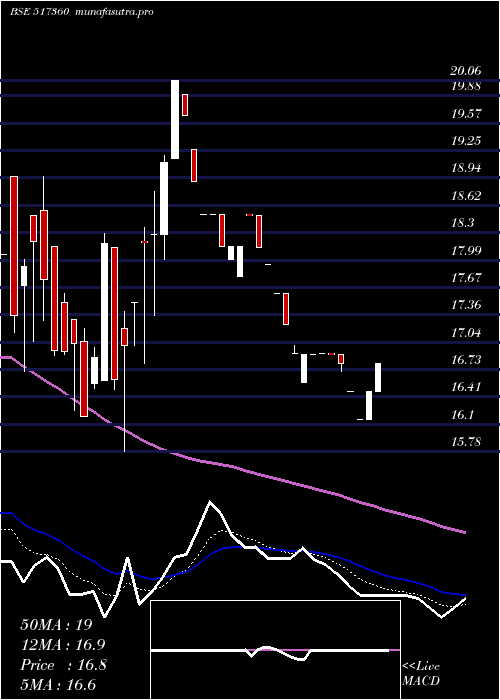
Daily price and volume Sbec Systems
| Date |
Closing |
Open |
Range |
Volume |
Thu 23 October 2025 |
23.00 (1.37%) |
22.69 |
21.60 - 23.50 |
0.3659 times |
Tue 21 October 2025 |
22.69 (-4.98%) |
23.64 |
22.69 - 23.64 |
0.7118 times |
Mon 20 October 2025 |
23.88 (4.97%) |
22.26 |
21.66 - 23.88 |
0.2412 times |
Fri 17 October 2025 |
22.75 (0.98%) |
23.65 |
22.13 - 23.65 |
0.6805 times |
Thu 16 October 2025 |
22.53 (-3.51%) |
23.99 |
22.52 - 24.36 |
0.0923 times |
Wed 15 October 2025 |
23.35 (1.57%) |
24.00 |
22.00 - 24.00 |
0.5919 times |
Tue 14 October 2025 |
22.99 (-4.76%) |
24.14 |
22.94 - 25.34 |
1.1326 times |
Mon 13 October 2025 |
24.14 (-5%) |
25.53 |
24.14 - 26.40 |
2.0688 times |
Fri 10 October 2025 |
25.41 (10%) |
23.56 |
23.56 - 25.41 |
2.7685 times |
Thu 09 October 2025 |
23.10 (10%) |
20.01 |
20.01 - 23.10 |
1.3465 times |
Wed 08 October 2025 |
21.00 (5%) |
20.03 |
20.03 - 21.00 |
0.0058 times |
Weekly price and charts SbecSystems Strong weekly Stock price targets for SbecSystems 517360 are 22.3 and 24.58 | Weekly Target 1 | 20.55 | | Weekly Target 2 | 21.77 | | Weekly Target 3 | 22.826666666667 | | Weekly Target 4 | 24.05 | | Weekly Target 5 | 25.11 |
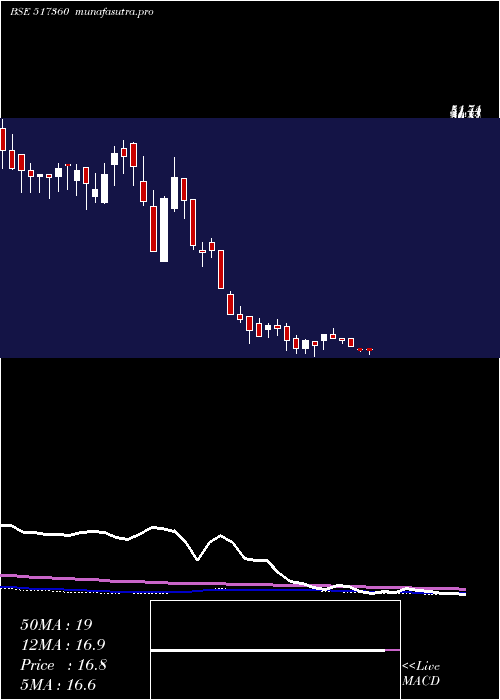
Weekly price and volumes for Sbec Systems
| Date |
Closing |
Open |
Range |
Volume |
Thu 23 October 2025 |
23.00 (1.1%) |
22.26 |
21.60 - 23.88 |
0.5816 times |
Fri 17 October 2025 |
22.75 (-10.47%) |
25.53 |
22.00 - 26.40 |
2.0135 times |
Fri 10 October 2025 |
25.41 (15.34%) |
21.92 |
20.00 - 25.41 |
2.261 times |
Fri 03 October 2025 |
22.03 (1.66%) |
20.63 |
20.63 - 23.37 |
0.1618 times |
Fri 26 September 2025 |
21.67 (-12.2%) |
25.74 |
21.67 - 25.74 |
0.651 times |
Fri 19 September 2025 |
24.68 (4.98%) |
23.51 |
22.90 - 25.10 |
0.4471 times |
Fri 12 September 2025 |
23.51 (-7.4%) |
26.65 |
22.45 - 26.65 |
1.1744 times |
Fri 05 September 2025 |
25.39 (-14.48%) |
31.15 |
22.99 - 31.15 |
0.7636 times |
Fri 29 August 2025 |
29.69 (21.48%) |
25.66 |
25.66 - 29.69 |
1.0907 times |
Fri 22 August 2025 |
24.44 (6.03%) |
22.60 |
22.14 - 24.44 |
0.8553 times |
Thu 14 August 2025 |
23.05 (-7.65%) |
24.47 |
23.05 - 24.47 |
0.175 times |
Monthly price and charts SbecSystems Strong monthly Stock price targets for SbecSystems 517360 are 19.8 and 26.2 | Monthly Target 1 | 16.73 | | Monthly Target 2 | 19.87 | | Monthly Target 3 | 23.133333333333 | | Monthly Target 4 | 26.27 | | Monthly Target 5 | 29.53 |
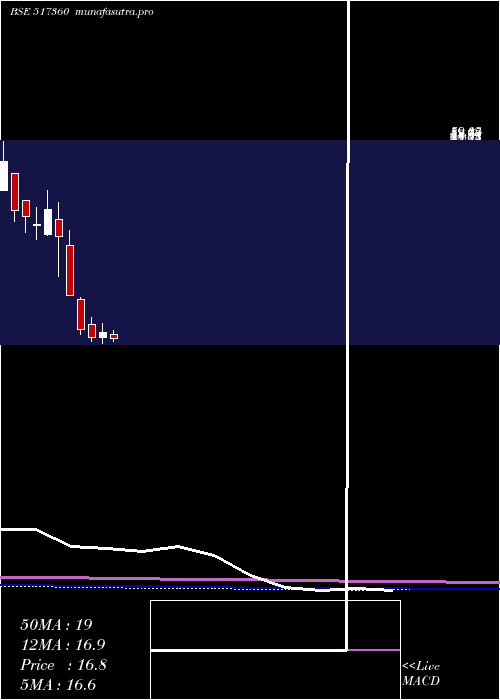
Monthly price and volumes Sbec Systems
| Date |
Closing |
Open |
Range |
Volume |
Thu 23 October 2025 |
23.00 (-1.16%) |
23.00 |
20.00 - 26.40 |
1.0733 times |
Tue 30 September 2025 |
23.27 (-21.62%) |
31.15 |
20.63 - 31.15 |
0.6546 times |
Fri 29 August 2025 |
29.69 (5.51%) |
27.58 |
22.14 - 29.69 |
0.6752 times |
Thu 31 July 2025 |
28.14 (-31.95%) |
39.29 |
26.09 - 39.29 |
1.9603 times |
Mon 30 June 2025 |
41.35 (123.51%) |
18.50 |
17.66 - 45.69 |
2.3104 times |
Fri 30 May 2025 |
18.50 (1.93%) |
17.80 |
15.96 - 20.39 |
0.4125 times |
Wed 30 April 2025 |
18.15 (6.58%) |
17.05 |
15.78 - 20.06 |
0.5681 times |
Fri 28 March 2025 |
17.03 (-9.89%) |
19.84 |
16.25 - 21.39 |
0.5644 times |
Fri 28 February 2025 |
18.90 (-27.36%) |
25.19 |
17.72 - 25.61 |
0.9793 times |
Fri 31 January 2025 |
26.02 (-32.66%) |
36.71 |
26.02 - 39.99 |
0.8017 times |
Tue 31 December 2024 |
38.64 (-13.11%) |
42.30 |
30.10 - 46.00 |
4.0038 times |
DMA SMA EMA moving averages of Sbec Systems 517360
DMA (daily moving average) of Sbec Systems 517360
| DMA period | DMA value | | 5 day DMA | 22.97 | | 12 day DMA | 22.9 | | 20 day DMA | 22.64 | | 35 day DMA | 23.37 | | 50 day DMA | 23.92 | | 100 day DMA | 26.86 | | 150 day DMA | 23.9 | | 200 day DMA | 24.93 | EMA (exponential moving average) of Sbec Systems 517360
| EMA period | EMA current | EMA prev | EMA prev2 | | 5 day EMA | 23.04 | 23.06 | 23.25 | | 12 day EMA | 23 | 23 | 23.06 | | 20 day EMA | 23.08 | 23.09 | 23.13 | | 35 day EMA | 23.45 | 23.48 | 23.53 | | 50 day EMA | 24 | 24.04 | 24.09 |
SMA (simple moving average) of Sbec Systems 517360
| SMA period | SMA current | SMA prev | SMA prev2 | | 5 day SMA | 22.97 | 23.04 | 23.1 | | 12 day SMA | 22.9 | 22.73 | 22.68 | | 20 day SMA | 22.64 | 22.69 | 22.73 | | 35 day SMA | 23.37 | 23.48 | 23.64 | | 50 day SMA | 23.92 | 23.96 | 24.02 | | 100 day SMA | 26.86 | 26.82 | 26.79 | | 150 day SMA | 23.9 | 23.88 | 23.86 | | 200 day SMA | 24.93 | 25.03 | 25.13 |
|
|
