MothersonSs 517334 full analysis,charts,indicators,moving averages,SMA,DMA,EMA,ADX,MACD,RSIMotherson Ss 517334 WideScreen charts, DMA,SMA,EMA technical analysis, forecast prediction, by indicators ADX,MACD,RSI,CCI BSE stock exchange
Daily price and charts and targets MothersonSs Strong Daily Stock price targets for MothersonSs 517334 are 104.25 and 106.15 | Daily Target 1 | 103.88 | | Daily Target 2 | 104.62 | | Daily Target 3 | 105.78333333333 | | Daily Target 4 | 106.52 | | Daily Target 5 | 107.68 |
Daily price and volume Motherson Ss
| Date |
Closing |
Open |
Range |
Volume |
Tue 21 October 2025 |
105.35 (-0.38%) |
106.95 |
105.05 - 106.95 |
0.1811 times |
Mon 20 October 2025 |
105.75 (1%) |
104.65 |
104.65 - 106.00 |
1.6863 times |
Fri 17 October 2025 |
104.70 (-2.38%) |
106.45 |
103.80 - 106.95 |
0.8893 times |
Thu 16 October 2025 |
107.25 (2.29%) |
104.35 |
104.35 - 108.55 |
2.4215 times |
Wed 15 October 2025 |
104.85 (-0.19%) |
105.00 |
103.90 - 105.80 |
0.7418 times |
Tue 14 October 2025 |
105.05 (0.96%) |
103.90 |
102.85 - 105.30 |
0.7576 times |
Mon 13 October 2025 |
104.05 (-0.05%) |
102.90 |
102.05 - 104.50 |
1.2198 times |
Fri 10 October 2025 |
104.10 (0.53%) |
103.35 |
102.80 - 104.90 |
0.9632 times |
Thu 09 October 2025 |
103.55 (1.92%) |
101.50 |
101.05 - 103.75 |
0.7001 times |
Wed 08 October 2025 |
101.60 (-2.4%) |
104.60 |
101.25 - 104.65 |
0.4393 times |
Tue 07 October 2025 |
104.10 (-2.02%) |
106.00 |
103.50 - 106.75 |
1.0732 times |
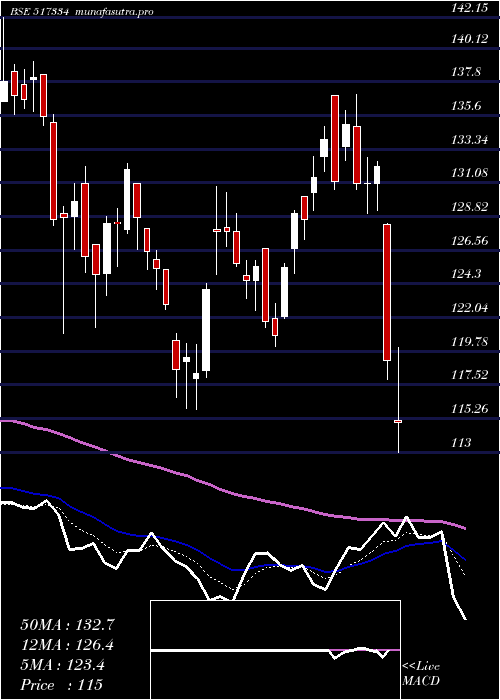
Weekly price and charts MothersonSs Strong weekly Stock price targets for MothersonSs 517334 are 105 and 107.3 | Weekly Target 1 | 103.35 | | Weekly Target 2 | 104.35 | | Weekly Target 3 | 105.65 | | Weekly Target 4 | 106.65 | | Weekly Target 5 | 107.95 |
Weekly price and volumes for Motherson Ss
| Date |
Closing |
Open |
Range |
Volume |
Tue 21 October 2025 |
105.35 (0.62%) |
104.65 |
104.65 - 106.95 |
0.2299 times |
Fri 17 October 2025 |
104.70 (0.58%) |
102.90 |
102.05 - 108.55 |
0.7422 times |
Fri 10 October 2025 |
104.10 (-2.39%) |
106.80 |
101.05 - 107.50 |
0.4276 times |
Fri 03 October 2025 |
106.65 (0.94%) |
106.00 |
104.52 - 107.28 |
0.4757 times |
Fri 26 September 2025 |
105.66 (-3.16%) |
108.35 |
103.22 - 112.59 |
1.057 times |
Fri 19 September 2025 |
109.11 (4.26%) |
105.96 |
105.30 - 111.91 |
1.5016 times |
Fri 12 September 2025 |
104.65 (10.62%) |
97.11 |
95.12 - 105.20 |
3.1119 times |
Fri 05 September 2025 |
94.60 (1.95%) |
94.20 |
93.43 - 98.19 |
0.8993 times |
Fri 29 August 2025 |
92.79 (-2.5%) |
95.70 |
91.11 - 96.00 |
0.5867 times |
Fri 22 August 2025 |
95.17 (2.23%) |
93.23 |
93.23 - 100.00 |
0.9682 times |
Thu 14 August 2025 |
93.09 (1.79%) |
91.39 |
89.69 - 94.50 |
0.8068 times |
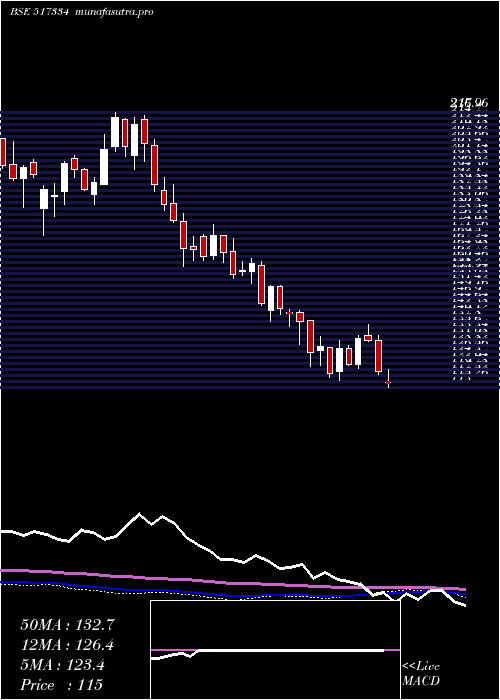
Monthly price and charts MothersonSs Strong monthly Stock price targets for MothersonSs 517334 are 99.45 and 106.95 | Monthly Target 1 | 97.48 | | Monthly Target 2 | 101.42 | | Monthly Target 3 | 104.98333333333 | | Monthly Target 4 | 108.92 | | Monthly Target 5 | 112.48 |
Monthly price and volumes Motherson Ss
| Date |
Closing |
Open |
Range |
Volume |
Tue 21 October 2025 |
105.35 (-0.27%) |
105.65 |
101.05 - 108.55 |
0.4605 times |
Tue 30 September 2025 |
105.63 (13.84%) |
94.20 |
93.43 - 112.59 |
2.0056 times |
Fri 29 August 2025 |
92.79 (-4.39%) |
97.06 |
89.69 - 100.00 |
0.8496 times |
Thu 31 July 2025 |
97.05 (-37.31%) |
155.35 |
95.85 - 159.00 |
0.8118 times |
Mon 30 June 2025 |
154.80 (1.18%) |
154.00 |
145.15 - 162.10 |
0.6064 times |
Fri 30 May 2025 |
153.00 (14.82%) |
133.20 |
130.40 - 158.65 |
1.2238 times |
Wed 30 April 2025 |
133.25 (1.72%) |
131.00 |
112.00 - 139.40 |
1.4175 times |
Fri 28 March 2025 |
131.00 (10.5%) |
119.10 |
115.85 - 137.00 |
0.8559 times |
Fri 28 February 2025 |
118.55 (-16.01%) |
141.40 |
116.70 - 142.15 |
1.3492 times |
Fri 31 January 2025 |
141.15 (-9.61%) |
156.05 |
136.05 - 161.75 |
0.4196 times |
Tue 31 December 2024 |
156.15 (-3.88%) |
162.95 |
152.50 - 174.50 |
0.6749 times |
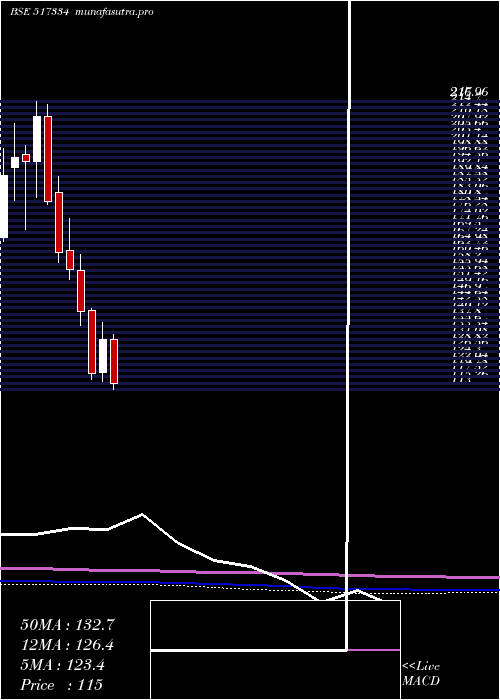
DMA SMA EMA moving averages of Motherson Ss 517334
DMA (daily moving average) of Motherson Ss 517334
| DMA period | DMA value | | 5 day DMA | 105.58 | | 12 day DMA | 104.72 | | 20 day DMA | 105.65 | | 35 day DMA | 104.38 | | 50 day DMA | 101.33 | | 100 day DMA | 119.25 | | 150 day DMA | 124.22 | | 200 day DMA | 128.13 | EMA (exponential moving average) of Motherson Ss 517334
| EMA period | EMA current | EMA prev | EMA prev2 | | 5 day EMA | 105.37 | 105.38 | 105.19 | | 12 day EMA | 105.23 | 105.21 | 105.11 | | 20 day EMA | 104.94 | 104.9 | 104.81 | | 35 day EMA | 103.08 | 102.95 | 102.78 | | 50 day EMA | 101.32 | 101.16 | 100.97 |
SMA (simple moving average) of Motherson Ss 517334
| SMA period | SMA current | SMA prev | SMA prev2 | | 5 day SMA | 105.58 | 105.52 | 105.18 | | 12 day SMA | 104.72 | 104.83 | 104.85 | | 20 day SMA | 105.65 | 105.87 | 106.04 | | 35 day SMA | 104.38 | 104.13 | 103.76 | | 50 day SMA | 101.33 | 101.1 | 100.89 | | 100 day SMA | 119.25 | 119.69 | 120.11 | | 150 day SMA | 124.22 | 124.34 | 124.42 | | 200 day SMA | 128.13 | 128.38 | 128.63 |
|
|
