GujInd 517300 full analysis,charts,indicators,moving averages,SMA,DMA,EMA,ADX,MACD,RSIGuj Ind 517300 WideScreen charts, DMA,SMA,EMA technical analysis, forecast prediction, by indicators ADX,MACD,RSI,CCI BSE stock exchange
Daily price and charts and targets GujInd Strong Daily Stock price targets for GujInd 517300 are 185.03 and 188.98 | Daily Target 1 | 182.05 | | Daily Target 2 | 184.05 | | Daily Target 3 | 186 | | Daily Target 4 | 188 | | Daily Target 5 | 189.95 |
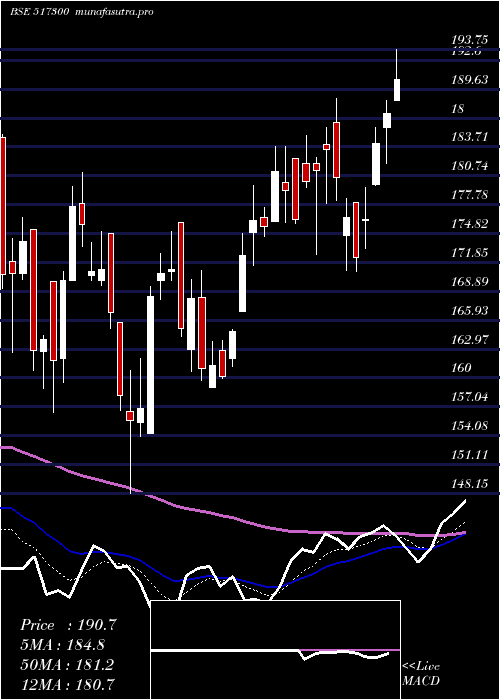
Daily price and volume Guj Ind
| Date |
Closing |
Open |
Range |
Volume |
Tue 21 October 2025 |
186.05 (1.22%) |
185.60 |
184.00 - 187.95 |
0.197 times |
Mon 20 October 2025 |
183.80 (6.15%) |
179.75 |
174.20 - 187.00 |
8.1737 times |
Fri 17 October 2025 |
173.15 (-1.23%) |
175.45 |
172.55 - 176.35 |
0.1152 times |
Thu 16 October 2025 |
175.30 (0.06%) |
175.45 |
173.85 - 177.65 |
0.1021 times |
Wed 15 October 2025 |
175.20 (-0.82%) |
176.10 |
174.10 - 179.45 |
0.251 times |
Tue 14 October 2025 |
176.65 (-2.05%) |
178.20 |
176.05 - 182.80 |
0.3506 times |
Mon 13 October 2025 |
180.35 (-1.98%) |
181.50 |
180.00 - 183.30 |
0.4175 times |
Fri 10 October 2025 |
184.00 (1.1%) |
181.45 |
181.45 - 185.55 |
0.153 times |
Thu 09 October 2025 |
182.00 (0.58%) |
181.35 |
180.10 - 186.95 |
0.1375 times |
Wed 08 October 2025 |
180.95 (-1.01%) |
183.05 |
180.55 - 183.75 |
0.1023 times |
Tue 07 October 2025 |
182.80 (-0.71%) |
183.90 |
182.05 - 187.60 |
0.2149 times |
Weekly price and charts GujInd Strong weekly Stock price targets for GujInd 517300 are 180.13 and 193.88 | Weekly Target 1 | 168.98 | | Weekly Target 2 | 177.52 | | Weekly Target 3 | 182.73333333333 | | Weekly Target 4 | 191.27 | | Weekly Target 5 | 196.48 |
Weekly price and volumes for Guj Ind
| Date |
Closing |
Open |
Range |
Volume |
Tue 21 October 2025 |
186.05 (7.45%) |
179.75 |
174.20 - 187.95 |
4.3007 times |
Fri 17 October 2025 |
173.15 (-5.9%) |
181.50 |
172.55 - 183.30 |
0.6353 times |
Fri 10 October 2025 |
184.00 (-0.57%) |
184.10 |
180.10 - 189.15 |
0.369 times |
Fri 03 October 2025 |
185.05 (0.73%) |
184.50 |
180.00 - 185.50 |
0.6115 times |
Fri 26 September 2025 |
183.70 (-2.26%) |
187.95 |
181.65 - 194.35 |
0.7081 times |
Fri 19 September 2025 |
187.95 (0.53%) |
186.55 |
186.55 - 192.50 |
0.5105 times |
Fri 12 September 2025 |
186.95 (-3.91%) |
198.85 |
186.00 - 200.00 |
1.1583 times |
Fri 05 September 2025 |
194.55 (9.27%) |
182.85 |
181.35 - 204.35 |
1.2097 times |
Fri 29 August 2025 |
178.05 (-5.22%) |
187.05 |
177.00 - 189.25 |
0.2578 times |
Fri 22 August 2025 |
187.85 (1.57%) |
186.05 |
184.70 - 193.70 |
0.239 times |
Thu 14 August 2025 |
184.95 (-4.02%) |
195.00 |
183.50 - 195.75 |
0.4597 times |

Monthly price and charts GujInd Strong monthly Stock price targets for GujInd 517300 are 179.3 and 195.9 | Monthly Target 1 | 165.98 | | Monthly Target 2 | 176.02 | | Monthly Target 3 | 182.58333333333 | | Monthly Target 4 | 192.62 | | Monthly Target 5 | 199.18 |
Monthly price and volumes Guj Ind
| Date |
Closing |
Open |
Range |
Volume |
Tue 21 October 2025 |
186.05 (2.73%) |
180.05 |
172.55 - 189.15 |
1.6303 times |
Tue 30 September 2025 |
181.10 (1.71%) |
182.85 |
180.00 - 204.35 |
1.1279 times |
Fri 29 August 2025 |
178.05 (-11.4%) |
200.45 |
177.00 - 200.45 |
0.4196 times |
Thu 31 July 2025 |
200.95 (-8.07%) |
221.15 |
193.20 - 224.00 |
1.3361 times |
Mon 30 June 2025 |
218.60 (11.79%) |
194.25 |
190.25 - 220.45 |
1.1092 times |
Fri 30 May 2025 |
195.55 (7.42%) |
181.05 |
169.30 - 210.00 |
0.8796 times |
Wed 30 April 2025 |
182.05 (1.03%) |
181.95 |
170.90 - 205.25 |
0.6649 times |
Fri 28 March 2025 |
180.20 (13.94%) |
156.55 |
148.15 - 184.85 |
1.116 times |
Fri 28 February 2025 |
158.15 (-19.33%) |
192.00 |
156.45 - 195.85 |
0.5226 times |
Fri 31 January 2025 |
196.05 (-14.01%) |
227.45 |
173.40 - 245.20 |
1.1937 times |
Tue 31 December 2024 |
228.00 (7.73%) |
212.05 |
208.50 - 268.25 |
2.5571 times |

DMA SMA EMA moving averages of Guj Ind 517300
DMA (daily moving average) of Guj Ind 517300
| DMA period | DMA value | | 5 day DMA | 178.7 | | 12 day DMA | 180.36 | | 20 day DMA | 182.1 | | 35 day DMA | 186.72 | | 50 day DMA | 186.87 | | 100 day DMA | 195.86 | | 150 day DMA | 191.46 | | 200 day DMA | 192.56 | EMA (exponential moving average) of Guj Ind 517300
| EMA period | EMA current | EMA prev | EMA prev2 | | 5 day EMA | 181.1 | 178.63 | 176.04 | | 12 day EMA | 180.91 | 179.98 | 179.28 | | 20 day EMA | 182.3 | 181.9 | 181.7 | | 35 day EMA | 184.32 | 184.22 | 184.25 | | 50 day EMA | 186.71 | 186.74 | 186.86 |
SMA (simple moving average) of Guj Ind 517300
| SMA period | SMA current | SMA prev | SMA prev2 | | 5 day SMA | 178.7 | 176.82 | 176.13 | | 12 day SMA | 180.36 | 180.28 | 180.11 | | 20 day SMA | 182.1 | 182.31 | 182.52 | | 35 day SMA | 186.72 | 186.66 | 186.5 | | 50 day SMA | 186.87 | 186.99 | 187.16 | | 100 day SMA | 195.86 | 195.98 | 196.16 | | 150 day SMA | 191.46 | 191.34 | 191.17 | | 200 day SMA | 192.56 | 192.8 | 193.09 |
|
|
