SS 517273 full analysis,charts,indicators,moving averages,SMA,DMA,EMA,ADX,MACD,RSIS S 517273 WideScreen charts, DMA,SMA,EMA technical analysis, forecast prediction, by indicators ADX,MACD,RSI,CCI BSE stock exchange
Daily price and charts and targets SS Strong Daily Stock price targets for SS 517273 are 352 and 352 | Daily Target 1 | 352 | | Daily Target 2 | 352 | | Daily Target 3 | 352 | | Daily Target 4 | 352 | | Daily Target 5 | 352 |
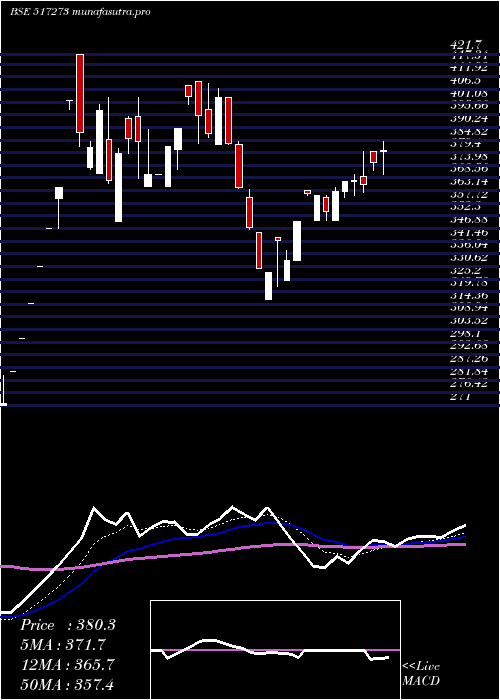
Daily price and volume S S
| Date |
Closing |
Open |
Range |
Volume |
Thu 23 October 2025 |
352.00 (-2.99%) |
352.00 |
352.00 - 352.00 |
0.0014 times |
Tue 21 October 2025 |
362.85 (5.63%) |
362.95 |
351.70 - 365.65 |
0.1483 times |
Mon 20 October 2025 |
343.50 (0.15%) |
343.00 |
335.80 - 344.00 |
0.0742 times |
Fri 17 October 2025 |
343.00 (-2.78%) |
354.00 |
340.75 - 358.00 |
0.4393 times |
Thu 16 October 2025 |
352.80 (3.02%) |
368.15 |
352.70 - 368.15 |
0.5876 times |
Wed 15 October 2025 |
342.45 (3.46%) |
334.20 |
330.00 - 343.00 |
0.8587 times |
Tue 14 October 2025 |
331.00 (-2%) |
330.30 |
322.80 - 331.25 |
0.2097 times |
Mon 13 October 2025 |
337.75 (-3.17%) |
350.10 |
337.75 - 350.10 |
0.0956 times |
Fri 10 October 2025 |
348.80 (-1.33%) |
366.55 |
345.00 - 370.20 |
1.6203 times |
Thu 09 October 2025 |
353.50 (-5.2%) |
374.00 |
350.00 - 375.75 |
5.9649 times |
Wed 08 October 2025 |
372.90 (-4.38%) |
383.35 |
362.70 - 383.35 |
1.3679 times |
Weekly price and charts SS Strong weekly Stock price targets for SS 517273 are 343.9 and 373.75 | Weekly Target 1 | 321.3 | | Weekly Target 2 | 336.65 | | Weekly Target 3 | 351.15 | | Weekly Target 4 | 366.5 | | Weekly Target 5 | 381 |
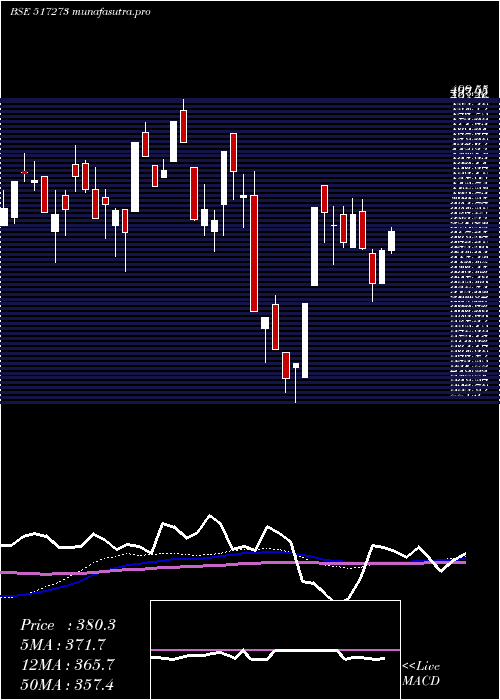
Weekly price and volumes for S S
| Date |
Closing |
Open |
Range |
Volume |
Thu 23 October 2025 |
352.00 (2.62%) |
343.00 |
335.80 - 365.65 |
0.0479 times |
Fri 17 October 2025 |
343.00 (-1.66%) |
350.10 |
322.80 - 368.15 |
0.4683 times |
Fri 10 October 2025 |
348.80 (-10.47%) |
392.40 |
345.00 - 392.40 |
1.9368 times |
Tue 30 September 2025 |
389.60 (0.09%) |
370.55 |
370.55 - 393.90 |
0.0518 times |
Fri 26 September 2025 |
389.25 (-1.75%) |
400.50 |
380.20 - 413.40 |
1.4581 times |
Fri 19 September 2025 |
396.20 (-11.06%) |
435.35 |
393.80 - 456.00 |
1.238 times |
Fri 12 September 2025 |
445.45 (13.64%) |
411.00 |
393.05 - 452.45 |
2.5832 times |
Fri 05 September 2025 |
392.00 (1.82%) |
384.95 |
365.75 - 409.00 |
1.3053 times |
Fri 29 August 2025 |
385.00 (-4.19%) |
401.85 |
371.10 - 421.00 |
0.6751 times |
Fri 22 August 2025 |
401.85 (-2.24%) |
411.05 |
394.00 - 415.00 |
0.2354 times |
Thu 14 August 2025 |
411.05 (6.77%) |
385.00 |
385.00 - 411.05 |
0.3705 times |
Monthly price and charts SS Strong monthly Stock price targets for SS 517273 are 302.6 and 372.2 | Monthly Target 1 | 286.13 | | Monthly Target 2 | 319.07 | | Monthly Target 3 | 355.73333333333 | | Monthly Target 4 | 388.67 | | Monthly Target 5 | 425.33 |
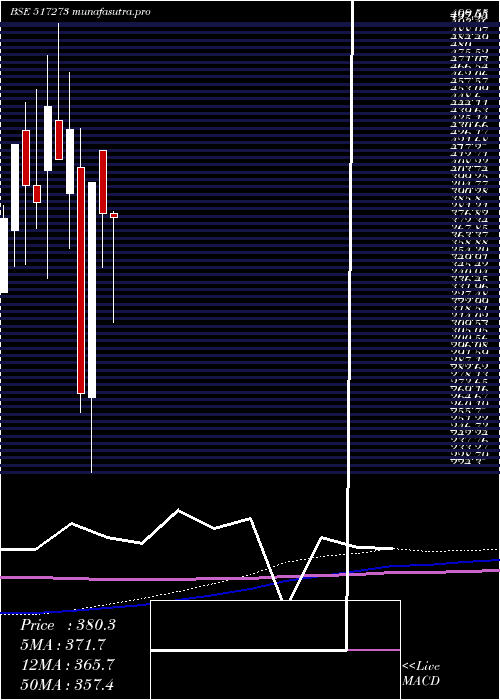
Monthly price and volumes S S
| Date |
Closing |
Open |
Range |
Volume |
Thu 23 October 2025 |
352.00 (-9.65%) |
392.40 |
322.80 - 392.40 |
0.542 times |
Tue 30 September 2025 |
389.60 (1.19%) |
384.95 |
365.75 - 456.00 |
1.4662 times |
Fri 29 August 2025 |
385.00 (3.61%) |
365.00 |
365.00 - 421.00 |
0.3764 times |
Thu 31 July 2025 |
371.60 (0.24%) |
365.00 |
357.55 - 454.75 |
1.0149 times |
Mon 30 June 2025 |
370.70 (11.19%) |
334.95 |
325.30 - 389.95 |
0.5505 times |
Fri 30 May 2025 |
333.40 (-12.98%) |
383.00 |
316.30 - 384.00 |
0.9145 times |
Wed 30 April 2025 |
383.15 (-4.61%) |
421.70 |
350.05 - 421.70 |
0.9059 times |
Fri 28 March 2025 |
401.65 (47.31%) |
270.00 |
224.30 - 401.65 |
0.8312 times |
Fri 28 February 2025 |
272.65 (-37.19%) |
410.95 |
260.95 - 434.95 |
1.8748 times |
Fri 31 January 2025 |
434.10 (4.33%) |
395.30 |
361.30 - 469.00 |
1.5235 times |
Tue 31 December 2024 |
416.10 (-7.23%) |
439.60 |
416.10 - 499.55 |
0.9392 times |
DMA SMA EMA moving averages of S S 517273
DMA (daily moving average) of S S 517273
| DMA period | DMA value | | 5 day DMA | 350.83 | | 12 day DMA | 352.55 | | 20 day DMA | 369.05 | | 35 day DMA | 386.43 | | 50 day DMA | 389.45 | | 100 day DMA | 384.37 | | 150 day DMA | 368.22 | | 200 day DMA | 375.27 | EMA (exponential moving average) of S S 517273
| EMA period | EMA current | EMA prev | EMA prev2 | | 5 day EMA | 351.56 | 351.34 | 345.59 | | 12 day EMA | 357.11 | 358.04 | 357.17 | | 20 day EMA | 366.09 | 367.57 | 368.07 | | 35 day EMA | 374.18 | 375.49 | 376.23 | | 50 day EMA | 384.05 | 385.36 | 386.28 |
SMA (simple moving average) of S S 517273
| SMA period | SMA current | SMA prev | SMA prev2 | | 5 day SMA | 350.83 | 348.92 | 342.55 | | 12 day SMA | 352.55 | 355.68 | 358.27 | | 20 day SMA | 369.05 | 371.67 | 374.82 | | 35 day SMA | 386.43 | 387.46 | 388.63 | | 50 day SMA | 389.45 | 389.81 | 389.99 | | 100 day SMA | 384.37 | 384.5 | 384.55 | | 150 day SMA | 368.22 | 367.84 | 367.47 | | 200 day SMA | 375.27 | 375.72 | 376.09 |
|
|
